Estimated Value: $377,784 - $401,000
3
Beds
2
Baths
1,540
Sq Ft
$251/Sq Ft
Est. Value
About This Home
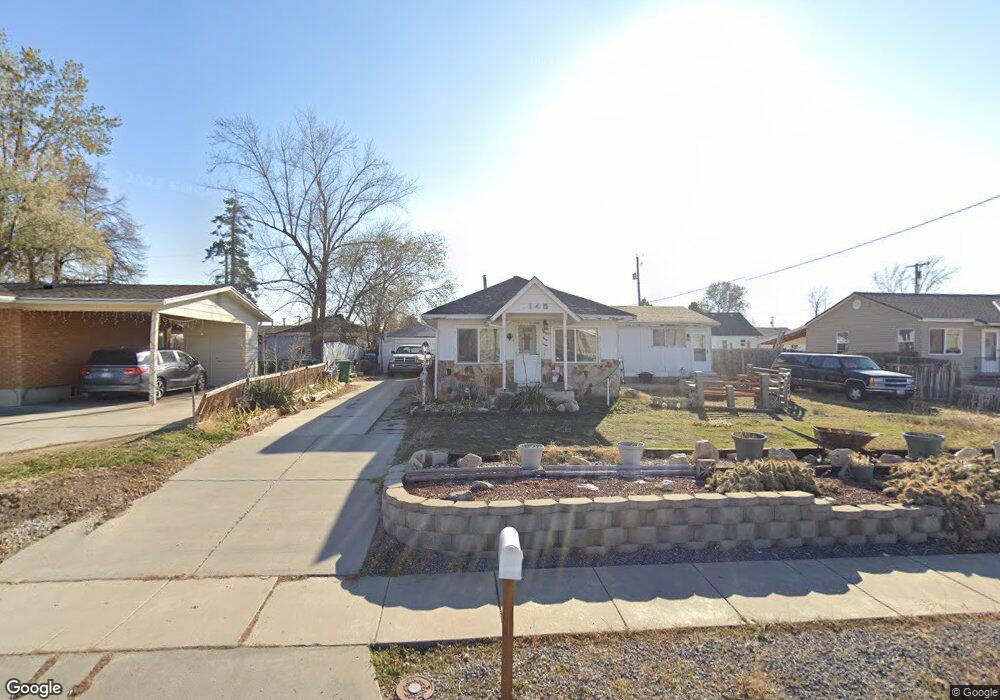
This home is located at 2145 W 4800 S, Roy, UT 84067 and is currently estimated at $385,946, approximately $250 per square foot. 2145 W 4800 S is a home located in Weber County with nearby schools including Lakeview Elementary School, Roy Junior High School, and Roy High School.
Ownership History
Date
Name
Owned For
Owner Type
Purchase Details
Closed on
Aug 1, 2001
Sold by
Trometter Harry L
Bought by
Thompson Deborah Lee
Current Estimated Value
Purchase Details
Closed on
Oct 23, 1997
Sold by
Cracroft V Thomas
Bought by
Trometter Harry L
Purchase Details
Closed on
Jun 24, 1996
Sold by
Va
Bought by
Mts Management Inc
Home Financials for this Owner
Home Financials are based on the most recent Mortgage that was taken out on this home.
Original Mortgage
$86,598
Interest Rate
8.25%
Mortgage Type
VA
Purchase Details
Closed on
Jun 21, 1996
Sold by
Mts Management Inc
Bought by
Trometter Harry L
Home Financials for this Owner
Home Financials are based on the most recent Mortgage that was taken out on this home.
Original Mortgage
$86,598
Interest Rate
8.25%
Mortgage Type
VA
Create a Home Valuation Report for This Property
The Home Valuation Report is an in-depth analysis detailing your home's value as well as a comparison with similar homes in the area
Home Values in the Area
Average Home Value in this Area
Purchase History
| Date | Buyer | Sale Price | Title Company |
|---|---|---|---|
| Thompson Deborah Lee | -- | U S Title | |
| Trometter Harry L | -- | -- | |
| Trometter Harry L | -- | -- | |
| Mts Management Inc | -- | Northern Title | |
| Trometter Harry L | -- | Northern Title |
Source: Public Records
Mortgage History
| Date | Status | Borrower | Loan Amount |
|---|---|---|---|
| Previous Owner | Trometter Harry L | $86,598 |
Source: Public Records
Tax History
| Year | Tax Paid | Tax Assessment Tax Assessment Total Assessment is a certain percentage of the fair market value that is determined by local assessors to be the total taxable value of land and additions on the property. | Land | Improvement |
|---|---|---|---|---|
| 2025 | $2,172 | $335,269 | $105,298 | $229,971 |
| 2024 | $2,066 | $175,998 | $57,914 | $118,084 |
| 2023 | $1,909 | $161,699 | $55,041 | $106,658 |
| 2022 | $2,127 | $188,650 | $50,203 | $138,447 |
| 2021 | $1,636 | $235,000 | $60,948 | $174,052 |
| 2020 | $1,557 | $206,000 | $60,948 | $145,052 |
| 2019 | $1,525 | $190,000 | $35,245 | $154,755 |
| 2018 | $1,489 | $175,000 | $32,588 | $142,412 |
| 2017 | $1,372 | $150,000 | $32,588 | $117,412 |
| 2016 | $1,228 | $71,230 | $16,520 | $54,710 |
| 2015 | $1,141 | $67,412 | $16,520 | $50,892 |
| 2014 | $1,145 | $67,090 | $14,078 | $53,012 |
Source: Public Records
Map
Nearby Homes
- 2038 W 4600 S
- 4881 S 2400 W
- 1838 W 5050 S
- 4642 S 1900 W Unit 41
- 1829 W 5050 S
- 5185 S 2100 W
- 1783 W 5000 S
- 4602 Hathaway Dr
- 1789 W 5050 S
- 1765 W 5000 S
- 5243 S 2200 W
- 4598 S Blossom Glen Way
- 1779 W 5125 S
- 5261 S 2200 W
- 5024 S 2575 W
- 5289 S 2200 W
- 2581 W 5000 S
- 4328 S 2175 W
- 5315 S 1950 W
- 5125 S 2600 W
Your Personal Tour Guide
Ask me questions while you tour the home.