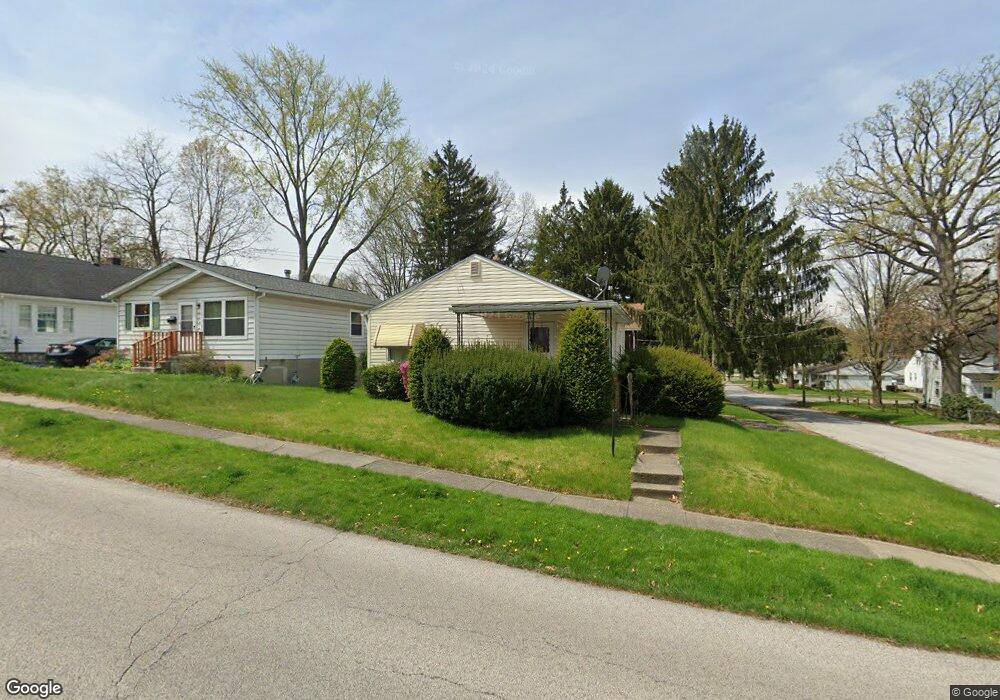
2146 10th St Cuyahoga Falls, OH 44221
Broad Boulevard NeighborhoodEstimated Value: $138,000 - $165,000
2
Beds
1
Bath
884
Sq Ft
$174/Sq Ft
Est. Value
About This Home
This home is located at 2146 10th St, Cuyahoga Falls, OH 44221 and is currently estimated at $153,848, approximately $174 per square foot. 2146 10th St is a home located in Summit County with nearby schools including Dewitt Elementary School, Bolich Middle School, and Cuyahoga Falls High School.
Ownership History
Date
Name
Owned For
Owner Type
Purchase Details
Closed on
Oct 14, 2020
Sold by
Rhoads Deborah L
Bought by
Warren Rebecca L
Current Estimated Value
Purchase Details
Closed on
Aug 10, 2020
Sold by
Rhoads Deborah L
Bought by
Warren Rebecca L
Purchase Details
Closed on
Aug 6, 2020
Sold by
Rhoads Deborah L and Warren Rebecca L
Bought by
Warren Rebecca L
Purchase Details
Closed on
Nov 15, 1999
Sold by
Shufelt Charles E
Bought by
Shufelt William C and Swain Patricia
Purchase Details
Closed on
Jan 11, 1999
Sold by
Shufelt Charles E and Shufelt Grayce J
Bought by
Shufelt Charles E
Create a Home Valuation Report for This Property
The Home Valuation Report is an in-depth analysis detailing your home's value as well as a comparison with similar homes in the area
Home Values in the Area
Average Home Value in this Area
Purchase History
| Date | Buyer | Sale Price | Title Company |
|---|---|---|---|
| Warren Rebecca L | -- | Law Office Of Margaret H Krein | |
| Warren Rebecca L | -- | Law Office Of Margaret H Krein | |
| Warren Rebecca L | -- | None Available | |
| Shufelt William C | -- | -- | |
| Shufelt Charles E | -- | -- |
Source: Public Records
Tax History Compared to Growth
Tax History
| Year | Tax Paid | Tax Assessment Tax Assessment Total Assessment is a certain percentage of the fair market value that is determined by local assessors to be the total taxable value of land and additions on the property. | Land | Improvement |
|---|---|---|---|---|
| 2025 | $2,362 | $40,958 | $9,762 | $31,196 |
| 2024 | $2,362 | $40,958 | $9,762 | $31,196 |
| 2023 | $2,362 | $40,958 | $9,762 | $31,196 |
| 2022 | $2,400 | $33,849 | $8,068 | $25,781 |
| 2021 | $2,300 | $33,849 | $8,068 | $25,781 |
| 2020 | $1,641 | $33,850 | $8,070 | $25,780 |
| 2019 | $1,509 | $29,770 | $7,910 | $21,860 |
| 2018 | $1,281 | $29,770 | $7,910 | $21,860 |
| 2017 | $1,283 | $29,770 | $7,910 | $21,860 |
| 2016 | $1,284 | $30,080 | $7,910 | $22,170 |
| 2015 | $1,283 | $30,080 | $7,910 | $22,170 |
| 2014 | $1,283 | $30,080 | $7,910 | $22,170 |
| 2013 | $1,389 | $32,030 | $7,910 | $24,120 |
Source: Public Records
Map
Nearby Homes