Estimated Value: $141,000 - $158,000
3
Beds
1
Bath
864
Sq Ft
$174/Sq Ft
Est. Value
About This Home
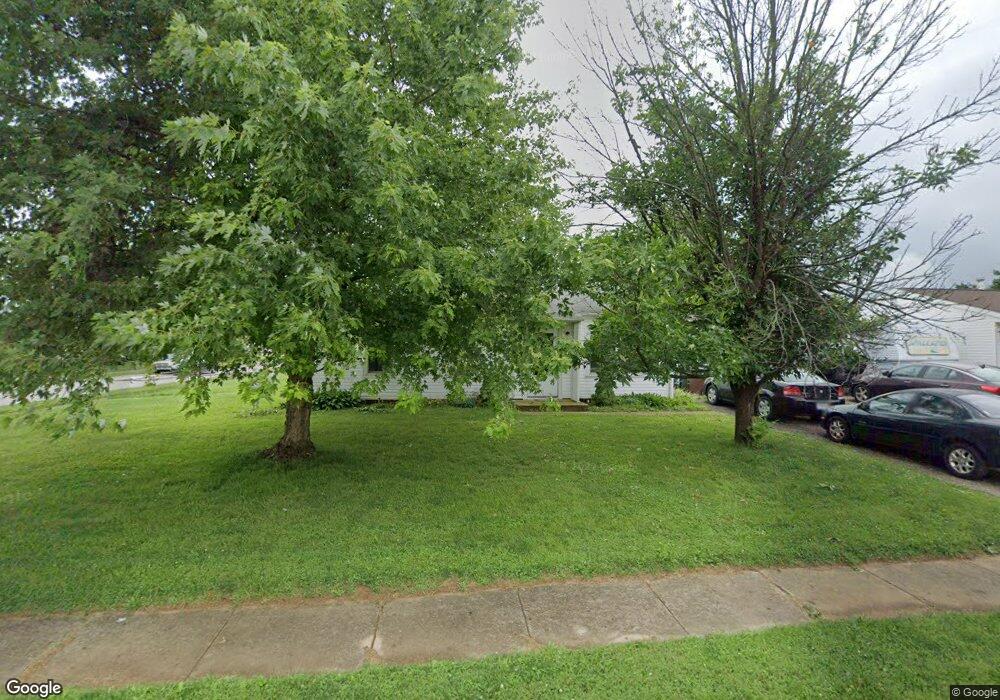
This home is located at 2146 Kylemore Dr, Xenia, OH 45385 and is currently estimated at $150,459, approximately $174 per square foot. 2146 Kylemore Dr is a home located in Greene County with nearby schools including Xenia High School, Summit Academy Community School for Alternative Learners - Xenia, and Legacy Christian Academy.
Ownership History
Date
Name
Owned For
Owner Type
Purchase Details
Closed on
Jun 10, 2014
Sold by
Shepherd Charles S
Bought by
Shepherd Dixie L
Current Estimated Value
Purchase Details
Closed on
Mar 4, 1999
Sold by
Pendergrass Kara
Bought by
Shepherd Charles S and Shepherd Alice B
Home Financials for this Owner
Home Financials are based on the most recent Mortgage that was taken out on this home.
Original Mortgage
$45,900
Outstanding Balance
$11,156
Interest Rate
6.8%
Mortgage Type
VA
Estimated Equity
$139,303
Create a Home Valuation Report for This Property
The Home Valuation Report is an in-depth analysis detailing your home's value as well as a comparison with similar homes in the area
Home Values in the Area
Average Home Value in this Area
Purchase History
| Date | Buyer | Sale Price | Title Company |
|---|---|---|---|
| Shepherd Dixie L | -- | None Available | |
| Shepherd Charles S | $45,000 | -- |
Source: Public Records
Mortgage History
| Date | Status | Borrower | Loan Amount |
|---|---|---|---|
| Open | Shepherd Charles S | $45,900 |
Source: Public Records
Tax History Compared to Growth
Tax History
| Year | Tax Paid | Tax Assessment Tax Assessment Total Assessment is a certain percentage of the fair market value that is determined by local assessors to be the total taxable value of land and additions on the property. | Land | Improvement |
|---|---|---|---|---|
| 2024 | $978 | $33,250 | $10,570 | $22,680 |
| 2023 | $978 | $33,250 | $10,570 | $22,680 |
| 2022 | $708 | $23,220 | $7,550 | $15,670 |
| 2021 | $717 | $23,220 | $7,550 | $15,670 |
| 2020 | $686 | $23,220 | $7,550 | $15,670 |
| 2019 | $559 | $19,840 | $5,550 | $14,290 |
| 2018 | $561 | $19,840 | $5,550 | $14,290 |
| 2017 | $515 | $19,840 | $5,550 | $14,290 |
| 2016 | $515 | $18,750 | $5,550 | $13,200 |
| 2015 | $995 | $18,750 | $5,550 | $13,200 |
| 2014 | $494 | $18,750 | $5,550 | $13,200 |
Source: Public Records
Map
Nearby Homes