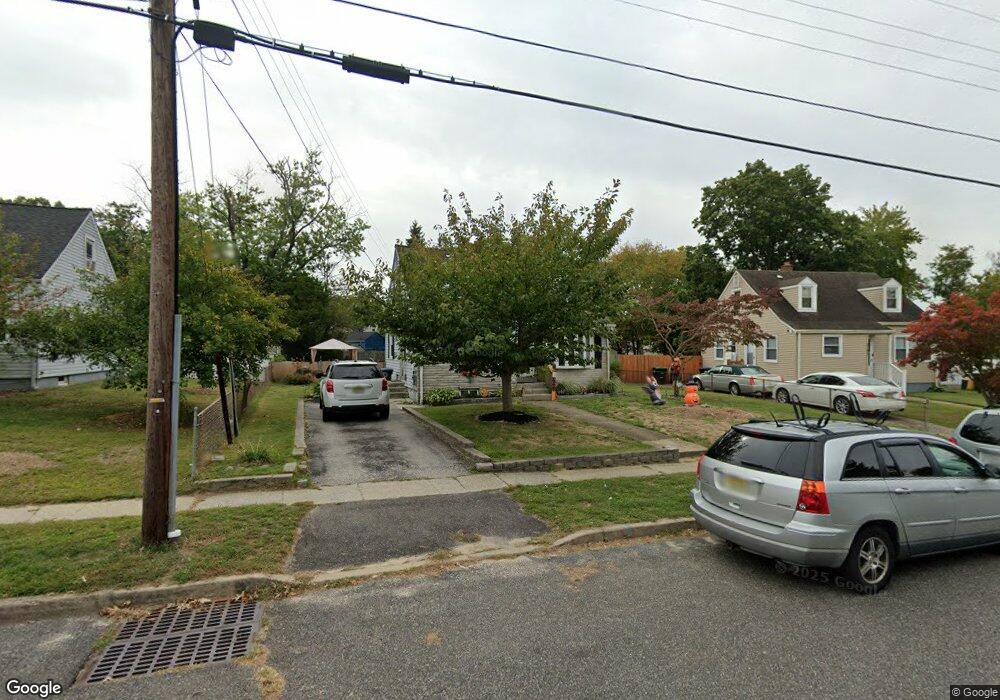
2146 S Brighton Ave Clementon, NJ 08021
Estimated Value: $268,000 - $289,000
--
Bed
--
Bath
979
Sq Ft
$282/Sq Ft
Est. Value
About This Home
This home is located at 2146 S Brighton Ave, Clementon, NJ 08021 and is currently estimated at $275,748, approximately $281 per square foot. 2146 S Brighton Ave is a home located in Camden County with nearby schools including Memorial Middle School, Lindenwold High School, and Our Lady Of Mt Carmel School.
Ownership History
Date
Name
Owned For
Owner Type
Purchase Details
Closed on
Apr 20, 2007
Sold by
Silva Wilfredo
Bought by
Rice Fred and Rice Heather
Current Estimated Value
Home Financials for this Owner
Home Financials are based on the most recent Mortgage that was taken out on this home.
Original Mortgage
$167,000
Outstanding Balance
$101,305
Interest Rate
6.21%
Estimated Equity
$174,443
Purchase Details
Closed on
Jun 17, 2005
Sold by
Silva George
Bought by
Silva Wilfredo
Home Financials for this Owner
Home Financials are based on the most recent Mortgage that was taken out on this home.
Original Mortgage
$135,000
Interest Rate
5.71%
Purchase Details
Closed on
Nov 29, 2000
Sold by
Cantu Michael A
Bought by
Silva George L and Echevarria Nellie
Home Financials for this Owner
Home Financials are based on the most recent Mortgage that was taken out on this home.
Original Mortgage
$88,500
Interest Rate
7.71%
Create a Home Valuation Report for This Property
The Home Valuation Report is an in-depth analysis detailing your home's value as well as a comparison with similar homes in the area
Home Values in the Area
Average Home Value in this Area
Purchase History
| Date | Buyer | Sale Price | Title Company |
|---|---|---|---|
| Rice Fred | $167,000 | -- | |
| Silva Wilfredo | $135,000 | -- | |
| Silva George L | $87,000 | -- |
Source: Public Records
Mortgage History
| Date | Status | Borrower | Loan Amount |
|---|---|---|---|
| Open | Rice Fred | $167,000 | |
| Previous Owner | Silva Wilfredo | $135,000 | |
| Previous Owner | Silva George L | $88,500 |
Source: Public Records
Tax History Compared to Growth
Tax History
| Year | Tax Paid | Tax Assessment Tax Assessment Total Assessment is a certain percentage of the fair market value that is determined by local assessors to be the total taxable value of land and additions on the property. | Land | Improvement |
|---|---|---|---|---|
| 2025 | $4,747 | $96,000 | $37,700 | $58,300 |
| 2024 | $4,773 | $96,000 | $37,700 | $58,300 |
| 2023 | $4,773 | $96,000 | $37,700 | $58,300 |
| 2022 | $4,768 | $96,000 | $37,700 | $58,300 |
| 2021 | $4,900 | $96,000 | $37,700 | $58,300 |
| 2020 | $4,871 | $96,000 | $37,700 | $58,300 |
| 2019 | $4,914 | $96,000 | $37,700 | $58,300 |
| 2018 | $4,902 | $96,000 | $37,700 | $58,300 |
| 2017 | $4,755 | $96,000 | $37,700 | $58,300 |
| 2016 | $4,648 | $96,000 | $37,700 | $58,300 |
| 2015 | $4,452 | $96,000 | $37,700 | $58,300 |
| 2014 | $4,259 | $96,000 | $37,700 | $58,300 |
Source: Public Records
Map
Nearby Homes
- 348 White Horse Pike
- 2290 S Cuthbert Dr
- 2309 S Cuthbert Dr
- 2298 S Cuthbert Dr
- 211 Chatham Dr
- 8 Norway Ave
- 56 Rowand Way E
- 21 Mulberry Ln
- 22 Magnolia Way
- 11 Dover Ct
- 108 Chelsea Cir
- 20 Shetland Dr
- 15 Jerome Terrace
- 146 Chelsea Cir Unit A129
- 28 Mulberry Ln
- 3 Harding Ave
- 5 Harding Ave
- 114 Ellis Ave
- 243 Van Horn Ave
- 115 Ellis Ave
- 2150 S Brighton Ave
- 2142 S Brighton Ave
- 114 United States Ave
- 114 United States Ave Unit ED
- 110 United States Ave
- 2138 S Brighton Ave
- 118 United States Ave
- 106 United States Ave Unit ED
- 106 United States Ave
- 202 Countiss Ave
- 2134 S Brighton Ave
- 2127 S Brighton Ave
- 102 United States Ave
- 201 Countiss Ave
- 202 United States Ave
- 206 Countiss Ave
- 2130 S Brighton Ave
- 22 United States Ave Unit ED
- 22 United States Ave
- 205 Countiss Ave