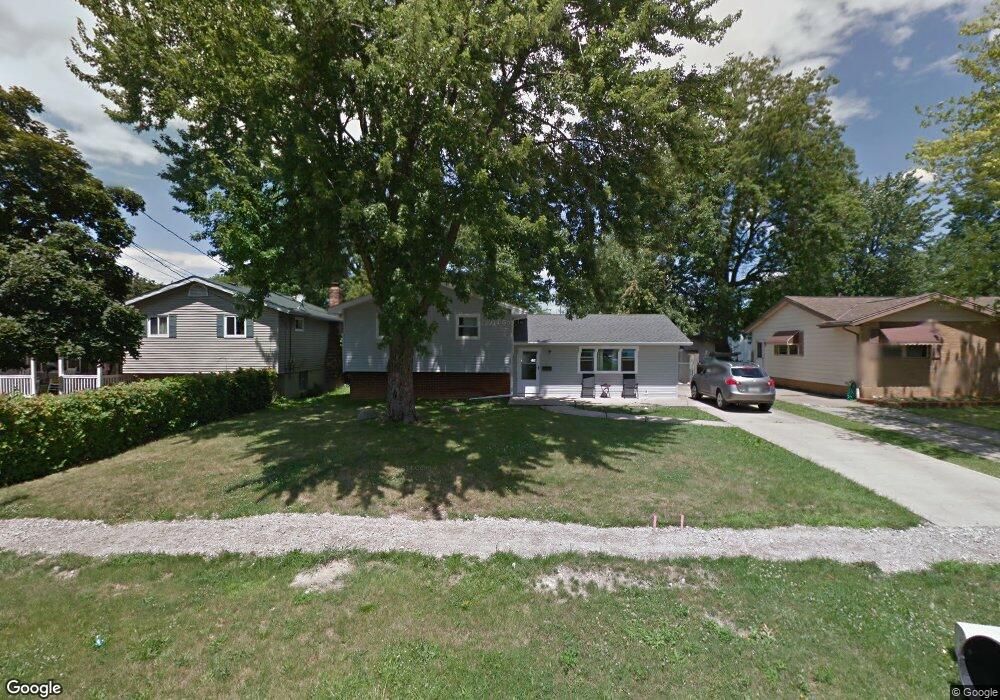
2147 E 41st St Lorain, OH 44055
Estimated Value: $155,372 - $169,000
3
Beds
2
Baths
1,378
Sq Ft
$118/Sq Ft
Est. Value
About This Home
This home is located at 2147 E 41st St, Lorain, OH 44055 and is currently estimated at $162,093, approximately $117 per square foot. 2147 E 41st St is a home located in Lorain County with nearby schools including Helen Steiner Rice Elementary School, Southview Middle School, and Lorain High School.
Ownership History
Date
Name
Owned For
Owner Type
Purchase Details
Closed on
Mar 15, 2010
Sold by
Fannie Mae
Bought by
Rose Scott J
Current Estimated Value
Home Financials for this Owner
Home Financials are based on the most recent Mortgage that was taken out on this home.
Original Mortgage
$68,732
Outstanding Balance
$45,622
Interest Rate
5.01%
Mortgage Type
FHA
Estimated Equity
$116,471
Purchase Details
Closed on
Jun 25, 2009
Sold by
Gonzalez Jose A
Bought by
Federal National Mortgage Association
Purchase Details
Closed on
Jun 25, 1997
Sold by
Ford Consumer Finance Co
Bought by
Gonzalez Jose A
Home Financials for this Owner
Home Financials are based on the most recent Mortgage that was taken out on this home.
Original Mortgage
$54,150
Interest Rate
8%
Create a Home Valuation Report for This Property
The Home Valuation Report is an in-depth analysis detailing your home's value as well as a comparison with similar homes in the area
Home Values in the Area
Average Home Value in this Area
Purchase History
| Date | Buyer | Sale Price | Title Company |
|---|---|---|---|
| Rose Scott J | $70,000 | Accutitle Agency Inc | |
| Federal National Mortgage Association | $55,000 | None Available | |
| Gonzalez Jose A | $57,000 | -- |
Source: Public Records
Mortgage History
| Date | Status | Borrower | Loan Amount |
|---|---|---|---|
| Open | Rose Scott J | $68,732 | |
| Previous Owner | Gonzalez Jose A | $54,150 |
Source: Public Records
Tax History
| Year | Tax Paid | Tax Assessment Tax Assessment Total Assessment is a certain percentage of the fair market value that is determined by local assessors to be the total taxable value of land and additions on the property. | Land | Improvement |
|---|---|---|---|---|
| 2024 | $1,668 | $39,473 | $5,191 | $34,283 |
| 2023 | $1,606 | $30,387 | $5,779 | $24,609 |
| 2022 | $1,592 | $30,387 | $5,779 | $24,609 |
| 2021 | $1,592 | $30,387 | $5,779 | $24,609 |
| 2020 | $1,475 | $24,460 | $4,650 | $19,810 |
| 2019 | $1,467 | $24,460 | $4,650 | $19,810 |
| 2018 | $1,421 | $24,460 | $4,650 | $19,810 |
| 2017 | $1,374 | $21,590 | $5,430 | $16,160 |
| 2016 | $1,363 | $21,590 | $5,430 | $16,160 |
| 2015 | $1,288 | $21,590 | $5,430 | $16,160 |
| 2014 | $1,229 | $20,650 | $5,190 | $15,460 |
| 2013 | $1,220 | $20,650 | $5,190 | $15,460 |
Source: Public Records
Map
Nearby Homes
- 4061 Gregus Ave
- 3934 Gary Ave
- V/L Clinton Ave
- V/L Grove Ave
- 1951 E 39th St
- 2217 E 32nd St
- 4210 Seneca Ave
- 4608 Gary Ave
- 1924 E 33rd St
- 2066 E 30th St
- 2228 E 30th St
- 2129 E 30th St
- 4217 Camden Ave
- 4617 Andover Ave
- 3308 Norfolk Ave
- 1816 E 34th St
- V/L Pearl Ave
- 1829 E 33rd St
- 4429 Norfolk Ave
- 4510 Riverside Dr
Your Personal Tour Guide
Ask me questions while you tour the home.