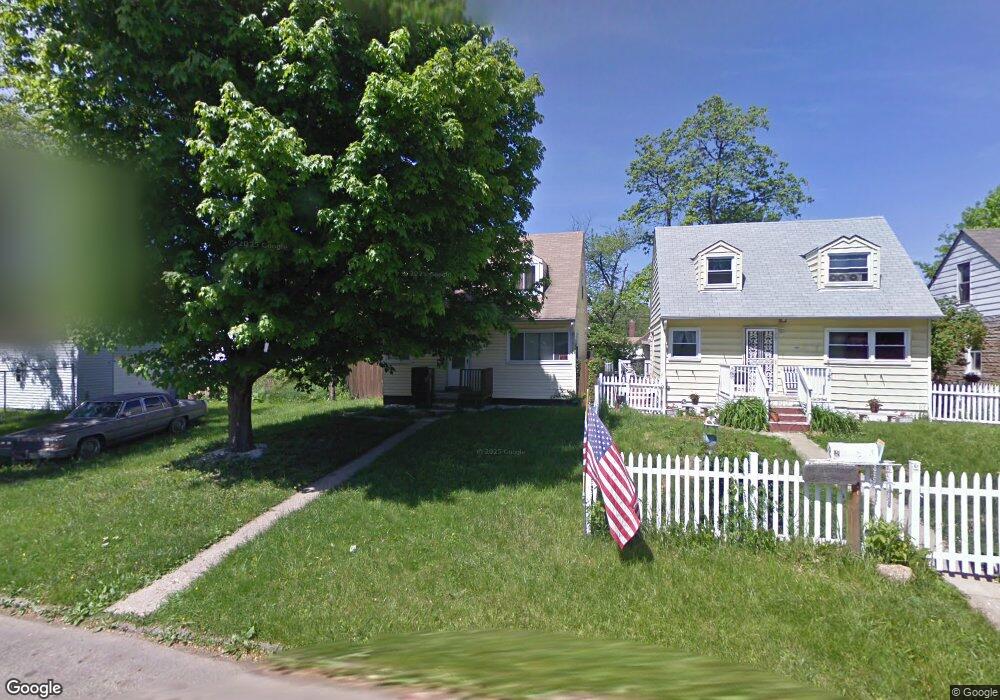
2147 Gerbert Rd Columbus, OH 43211
South Linden NeighborhoodEstimated Value: $104,641 - $141,000
2
Beds
1
Bath
907
Sq Ft
$141/Sq Ft
Est. Value
About This Home
This home is located at 2147 Gerbert Rd, Columbus, OH 43211 and is currently estimated at $127,660, approximately $140 per square foot. 2147 Gerbert Rd is a home located in Franklin County with nearby schools including Linden-Mckinley Stem School On Arcadia, North Columbus Preparatory Academy, and Midnimo Cross Cultural Middle School.
Ownership History
Date
Name
Owned For
Owner Type
Purchase Details
Closed on
Sep 24, 2004
Sold by
Cannaday Valerie
Bought by
Calhoun Kenneth J
Current Estimated Value
Home Financials for this Owner
Home Financials are based on the most recent Mortgage that was taken out on this home.
Original Mortgage
$57,000
Outstanding Balance
$30,384
Interest Rate
7.37%
Mortgage Type
Purchase Money Mortgage
Estimated Equity
$97,276
Purchase Details
Closed on
May 15, 1998
Sold by
Dana Randall M and Dana Nancy
Bought by
Cannaday Valerie
Home Financials for this Owner
Home Financials are based on the most recent Mortgage that was taken out on this home.
Original Mortgage
$46,400
Interest Rate
7.19%
Mortgage Type
Balloon
Purchase Details
Closed on
Jan 29, 1998
Sold by
Sweet Tree Investments Inc
Bought by
Dana Randall M
Create a Home Valuation Report for This Property
The Home Valuation Report is an in-depth analysis detailing your home's value as well as a comparison with similar homes in the area
Home Values in the Area
Average Home Value in this Area
Purchase History
| Date | Buyer | Sale Price | Title Company |
|---|---|---|---|
| Calhoun Kenneth J | $57,000 | Independent | |
| Cannaday Valerie | $58,000 | -- | |
| Dana Randall M | $26,500 | Acs Title Down Town | |
| Sweet Tree Investments Inc | $21,300 | Acs Title |
Source: Public Records
Mortgage History
| Date | Status | Borrower | Loan Amount |
|---|---|---|---|
| Open | Calhoun Kenneth J | $57,000 | |
| Previous Owner | Cannaday Valerie | $46,400 |
Source: Public Records
Tax History
| Year | Tax Paid | Tax Assessment Tax Assessment Total Assessment is a certain percentage of the fair market value that is determined by local assessors to be the total taxable value of land and additions on the property. | Land | Improvement |
|---|---|---|---|---|
| 2025 | $1,287 | $28,670 | $5,360 | $23,310 |
| 2024 | $1,287 | $28,670 | $5,360 | $23,310 |
| 2023 | $1,270 | $28,665 | $5,355 | $23,310 |
| 2022 | $706 | $13,620 | $2,560 | $11,060 |
| 2021 | $708 | $13,620 | $2,560 | $11,060 |
| 2020 | $709 | $13,620 | $2,560 | $11,060 |
| 2019 | $684 | $11,280 | $2,140 | $9,140 |
| 2018 | $674 | $11,280 | $2,140 | $9,140 |
| 2017 | $684 | $11,280 | $2,140 | $9,140 |
| 2016 | $733 | $11,060 | $2,590 | $8,470 |
| 2015 | $665 | $11,060 | $2,590 | $8,470 |
| 2014 | $667 | $11,060 | $2,590 | $8,470 |
| 2013 | $365 | $12,285 | $2,870 | $9,415 |
Source: Public Records
Map
Nearby Homes
- 2210 Gerbert Rd
- 2166 Lexington Ave
- 2173 Lexington Ave
- 2243-2245 Lexington Ave
- 2225 Medina Ave
- 2260 Homestead Dr
- 2332 Hamilton Ave
- 2204 Medina Ave
- 2316 Ontario St
- 2311 McGuffey Rd
- 2362 McGuffey Rd
- 1301 E 26th Ave
- 2195 Dresden St
- 1362 Clinton St
- 1084 E Hudson St
- 1129 E 23rd Ave Unit 1129 - 1131
- 1204 Loretta Ave
- 1335 E 25th Ave Unit 337
- 1218 E 22nd Ave
- 1033 E 22nd Ave
- 2151 Gerbert Rd
- 2157 Gerbert Rd
- 1146 Duxberry Ave
- 1152 Duxberry Ave
- 1140 Duxberry Ave
- 2163 Gerbert Rd
- 1136 Duxberry Ave
- 2158 Hamilton Ave
- 1130 Duxberry Ave
- 2164 Hamilton Ave
- 1164 Duxberry Ave
- 2146 Gerbert Rd
- 2168 Hamilton Ave
- 2152 Gerbert Rd
- 1124 Duxberry Ave
- 2156 Gerbert Rd
- 1170 Duxberry Ave
- 2173 Gerbert Rd
- 2160 Gerbert Rd
- 2180 Hamilton Ave
Your Personal Tour Guide
Ask me questions while you tour the home.