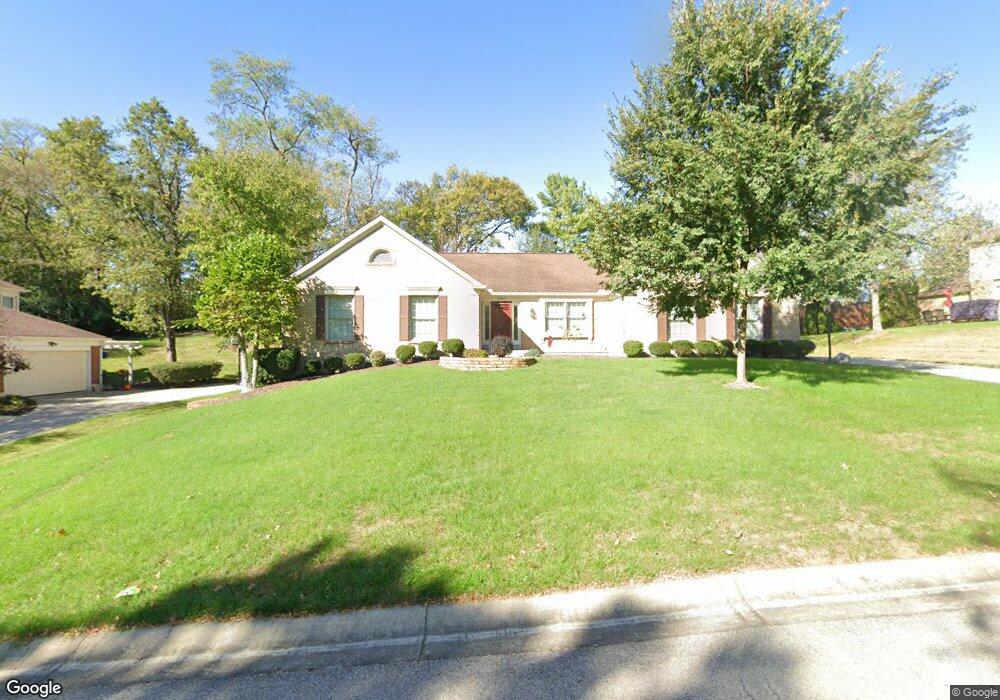
2147 Hunters Point Ln Cincinnati, OH 45244
Dry Run NeighborhoodEstimated Value: $443,000 - $503,000
3
Beds
3
Baths
1,940
Sq Ft
$242/Sq Ft
Est. Value
About This Home
This home is located at 2147 Hunters Point Ln, Cincinnati, OH 45244 and is currently estimated at $469,047, approximately $241 per square foot. 2147 Hunters Point Ln is a home located in Hamilton County with nearby schools including Wilson Elementary School, Nagel Middle School, and Turpin High School.
Ownership History
Date
Name
Owned For
Owner Type
Purchase Details
Closed on
Aug 28, 2006
Sold by
Ruehl Margaret B
Bought by
Holly James J and Holly Cheryl L
Current Estimated Value
Home Financials for this Owner
Home Financials are based on the most recent Mortgage that was taken out on this home.
Original Mortgage
$186,000
Interest Rate
6.7%
Mortgage Type
Unknown
Create a Home Valuation Report for This Property
The Home Valuation Report is an in-depth analysis detailing your home's value as well as a comparison with similar homes in the area
Home Values in the Area
Average Home Value in this Area
Purchase History
| Date | Buyer | Sale Price | Title Company |
|---|---|---|---|
| Holly James J | -- | None Available |
Source: Public Records
Mortgage History
| Date | Status | Borrower | Loan Amount |
|---|---|---|---|
| Closed | Holly James J | $186,000 |
Source: Public Records
Tax History Compared to Growth
Tax History
| Year | Tax Paid | Tax Assessment Tax Assessment Total Assessment is a certain percentage of the fair market value that is determined by local assessors to be the total taxable value of land and additions on the property. | Land | Improvement |
|---|---|---|---|---|
| 2024 | $7,167 | $127,992 | $27,178 | $100,814 |
| 2023 | $6,862 | $127,992 | $27,178 | $100,814 |
| 2022 | $6,092 | $102,684 | $26,737 | $75,947 |
| 2021 | $5,938 | $102,684 | $26,737 | $75,947 |
| 2020 | $6,019 | $102,684 | $26,737 | $75,947 |
| 2019 | $5,793 | $90,871 | $23,660 | $67,211 |
| 2018 | $5,426 | $90,871 | $23,660 | $67,211 |
| 2017 | $5,111 | $90,871 | $23,660 | $67,211 |
| 2016 | $5,102 | $88,939 | $23,940 | $64,999 |
| 2015 | $4,962 | $88,939 | $23,940 | $64,999 |
| 2014 | $4,966 | $88,939 | $23,940 | $64,999 |
| 2013 | $4,180 | $80,126 | $21,567 | $58,559 |
Source: Public Records
Map
Nearby Homes
- 2083 Forestcrest Way
- 8032 Lancelot Dr
- 2193 Forestlake Dr
- L Clough Pike
- 7660 Clough Pike
- 7652 Clough Pike
- 8069 Ashgrove Dr
- 2117 Berrypatch Dr
- 1786 Woodpine Ln
- 2508 Little Dry Run Rd
- 1791 Rusticwood Ln
- Devonshire II Plan at Clough Chase
- Remington Plan at Clough Chase
- Tacoma Plan at Clough Chase
- Denison Plan at Clough Chase
- Manchester II Plan at Clough Chase
- Patterson Plan at Clough Chase
- Charleston Plan at Clough Chase
- Marquette Plan at Clough Chase
- Madison Plan at Clough Chase
- 2139 Hunters Point Ln
- 7925 Lancelot Dr
- 7915 Lancelot Dr
- 7885 Meadowcreek Dr
- 2131 Hunters Point Ln
- 7879 Meadowcreek Dr
- 7939 Lancelot Dr
- 7891 Meadowcreek Dr
- 2146 Hunters Point Ln
- 7873 Meadowcreek Dr
- 2138 Hunters Point Ln
- 2125 Hunters Point Ln
- 2125 Hunterspoint Ln
- Lt Meadowcreek Dr
- 7947 Lancelot Dr
- 2130 Hunters Point Ln
- 7924 Lancelot Dr
- 7914 Lancelot Dr
- 7904 Lancelot Dr
- 7867 Meadowcreek Dr