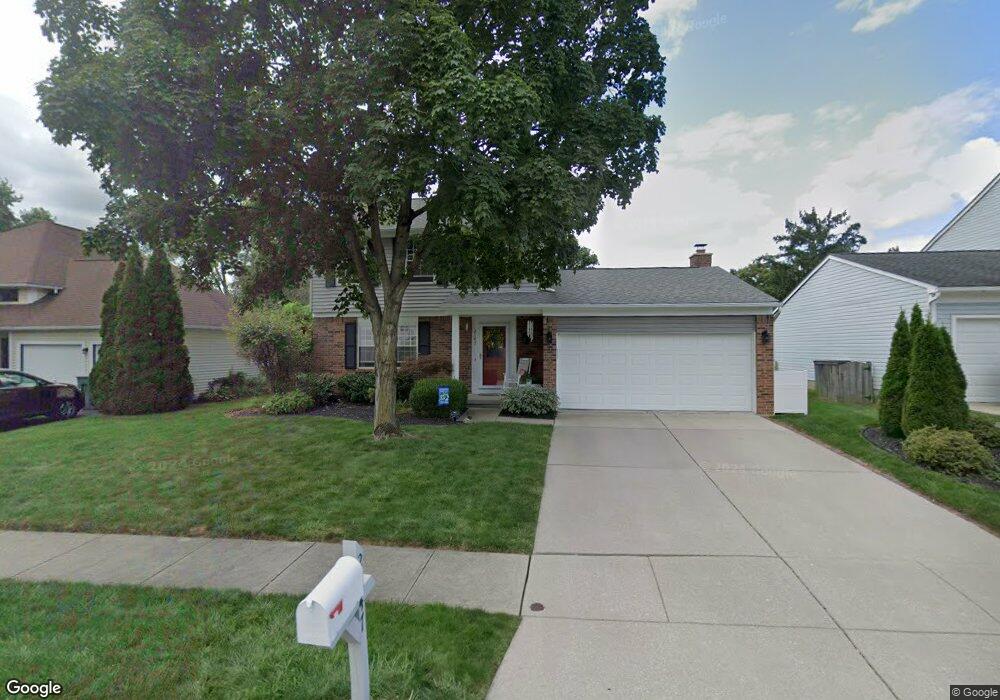
2147 Millrow Loop Dublin, OH 43016
Estimated Value: $360,000 - $386,000
3
Beds
3
Baths
1,565
Sq Ft
$237/Sq Ft
Est. Value
About This Home
This home is located at 2147 Millrow Loop, Dublin, OH 43016 and is currently estimated at $371,165, approximately $237 per square foot. 2147 Millrow Loop is a home located in Franklin County with nearby schools including Granby Elementary School, McCord Middle School, and Worthington Kilbourne High School.
Ownership History
Date
Name
Owned For
Owner Type
Purchase Details
Closed on
Jun 27, 2011
Sold by
Nessler John J and Nessler Mary Irene
Bought by
Matthews Thomas and Matthews Rachael Michelle
Current Estimated Value
Home Financials for this Owner
Home Financials are based on the most recent Mortgage that was taken out on this home.
Original Mortgage
$172,999
Outstanding Balance
$117,230
Interest Rate
4.5%
Mortgage Type
FHA
Estimated Equity
$253,935
Purchase Details
Closed on
Mar 15, 2001
Sold by
Geier Arthur W and Geier Susan
Bought by
Nessler John J and Nessler Mary Irene
Home Financials for this Owner
Home Financials are based on the most recent Mortgage that was taken out on this home.
Original Mortgage
$138,803
Interest Rate
7.13%
Mortgage Type
FHA
Purchase Details
Closed on
Dec 14, 1993
Bought by
Geier Arthur W and Geier Susan
Purchase Details
Closed on
May 1, 1985
Purchase Details
Closed on
Mar 1, 1985
Create a Home Valuation Report for This Property
The Home Valuation Report is an in-depth analysis detailing your home's value as well as a comparison with similar homes in the area
Home Values in the Area
Average Home Value in this Area
Purchase History
| Date | Buyer | Sale Price | Title Company |
|---|---|---|---|
| Matthews Thomas | $177,500 | Real Living | |
| Nessler John J | $139,900 | -- | |
| Geier Arthur W | $113,900 | -- | |
| -- | $79,900 | -- | |
| -- | $16,300 | -- |
Source: Public Records
Mortgage History
| Date | Status | Borrower | Loan Amount |
|---|---|---|---|
| Open | Matthews Thomas | $172,999 | |
| Closed | Nessler John J | $138,803 |
Source: Public Records
Tax History
| Year | Tax Paid | Tax Assessment Tax Assessment Total Assessment is a certain percentage of the fair market value that is determined by local assessors to be the total taxable value of land and additions on the property. | Land | Improvement |
|---|---|---|---|---|
| 2025 | $6,459 | $105,210 | $36,750 | $68,460 |
| 2024 | $6,459 | $105,210 | $36,750 | $68,460 |
| 2023 | $6,177 | $105,210 | $36,750 | $68,460 |
| 2022 | $5,469 | $73,920 | $17,010 | $56,910 |
| 2021 | $5,046 | $73,920 | $17,010 | $56,910 |
| 2020 | $4,860 | $73,920 | $17,010 | $56,910 |
| 2019 | $4,489 | $61,610 | $14,180 | $47,430 |
| 2018 | $4,194 | $61,610 | $14,180 | $47,430 |
| 2017 | $4,106 | $63,920 | $14,180 | $49,740 |
| 2016 | $4,038 | $56,880 | $13,860 | $43,020 |
| 2015 | $4,039 | $56,880 | $13,860 | $43,020 |
| 2014 | $4,038 | $56,880 | $13,860 | $43,020 |
| 2013 | $2,009 | $56,875 | $13,860 | $43,015 |
Source: Public Records
Map
Nearby Homes
- 2000 Dina Ct
- 2514 Tevis Ann Ct
- 7685 Starmont Ct
- 1908 Lost Valley Rd
- 1810 Calico Ct
- 1751 Darrow Dr
- 8213 Longhorn Rd
- 8205 Longhorn Rd
- 8377 Waco Ln
- 7480 Gardenview Place
- 7755 Tripoli Ct
- 7965 Boothbay Ct Unit 20
- 7735 Schoolway Ct
- 1729 Laredo Ct
- 8207 Copperfield Dr
- 2744 Saltergate Dr
- 2074 Hard Rd
- 1539 Clubview Blvd S
- 2621 Summer Dr
- 8245 Markhaven Ct
- 2141 Millrow Loop
- 2153 Millrow Loop
- 2137 Millrow Loop
- 8050 Simfield Rd
- 8038 Simfield Rd
- 2159 Millrow Loop
- 8028 Simfield Rd
- 8062 Simfield Rd
- 2121 Smokymill Rd
- 2140 Millrow Loop
- 2133 Millrow Loop
- 8020 Simfield Rd
- 8070 Simfield Rd
- 2124 Millrow Loop
- 2113 Smokymill Rd
- 2129 Millrow Loop
- 2125 Millrow Loop
- 8012 Simfield Rd
- 8078 Simfield Rd
- 8039 Simfield Rd
Your Personal Tour Guide
Ask me questions while you tour the home.