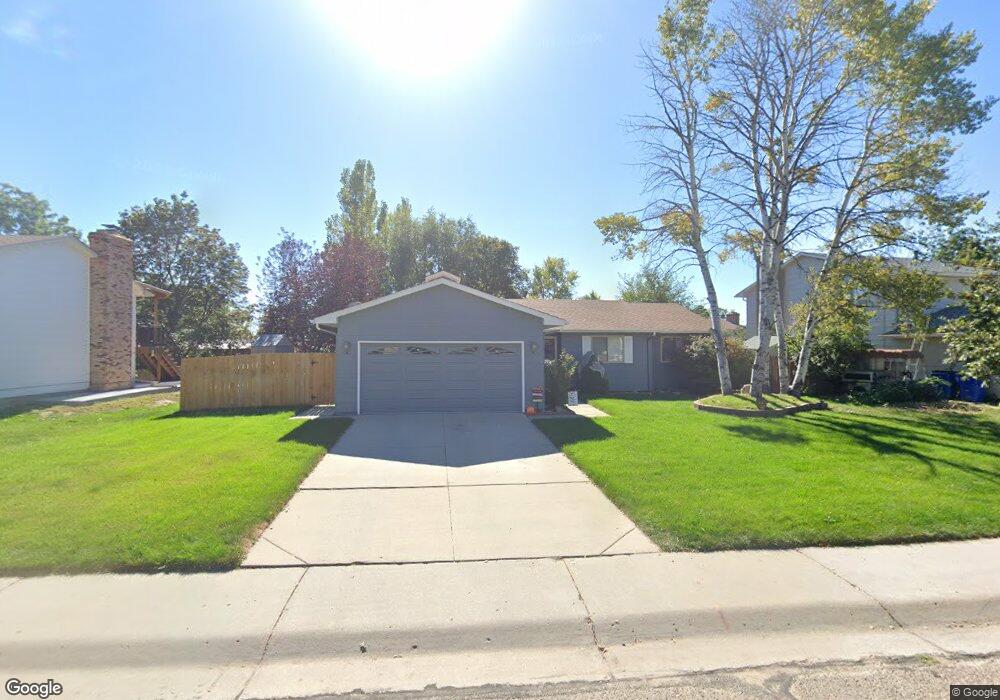
2148 44th Ave Greeley, CO 80634
Estimated Value: $417,000 - $463,000
4
Beds
3
Baths
2,230
Sq Ft
$196/Sq Ft
Est. Value
About This Home
This home is located at 2148 44th Ave, Greeley, CO 80634 and is currently estimated at $437,242, approximately $196 per square foot. 2148 44th Ave is a home located in Weld County with nearby schools including Monfort Elementary School, Brentwood Middle School, and Greeley West High School.
Ownership History
Date
Name
Owned For
Owner Type
Purchase Details
Closed on
Jan 23, 2012
Sold by
Bowra Carolyn K
Bought by
Wildt Sarah B and Wildt Thomas E
Current Estimated Value
Home Financials for this Owner
Home Financials are based on the most recent Mortgage that was taken out on this home.
Original Mortgage
$155,944
Outstanding Balance
$107,013
Interest Rate
4%
Mortgage Type
FHA
Estimated Equity
$330,229
Purchase Details
Closed on
Jan 30, 2006
Sold by
Garroutte Carolyn K
Bought by
Bowra Carolyn K
Purchase Details
Closed on
Jul 8, 1998
Sold by
Matthews E C Trust
Bought by
Garroutte Carolyn K
Home Financials for this Owner
Home Financials are based on the most recent Mortgage that was taken out on this home.
Original Mortgage
$90,000
Interest Rate
7.09%
Purchase Details
Closed on
Oct 15, 1993
Purchase Details
Closed on
Nov 1, 1982
Create a Home Valuation Report for This Property
The Home Valuation Report is an in-depth analysis detailing your home's value as well as a comparison with similar homes in the area
Purchase History
| Date | Buyer | Sale Price | Title Company |
|---|---|---|---|
| Wildt Sarah B | $160,000 | None Available | |
| Bowra Carolyn K | -- | None Available | |
| Garroutte Carolyn K | $120,000 | -- | |
| -- | -- | -- | |
| -- | -- | -- |
Source: Public Records
Mortgage History
| Date | Status | Borrower | Loan Amount |
|---|---|---|---|
| Open | Wildt Sarah B | $155,944 | |
| Previous Owner | Garroutte Carolyn K | $90,000 |
Source: Public Records
Tax History
| Year | Tax Paid | Tax Assessment Tax Assessment Total Assessment is a certain percentage of the fair market value that is determined by local assessors to be the total taxable value of land and additions on the property. | Land | Improvement |
|---|---|---|---|---|
| 2025 | $1,830 | $24,850 | $4,060 | $20,790 |
| 2024 | $1,830 | $24,850 | $4,060 | $20,790 |
| 2023 | $1,745 | $25,510 | $4,400 | $21,110 |
| 2022 | $1,928 | $22,110 | $4,240 | $17,870 |
| 2021 | $1,989 | $22,750 | $4,360 | $18,390 |
| 2020 | $1,730 | $19,850 | $3,360 | $16,490 |
| 2019 | $1,735 | $19,850 | $3,360 | $16,490 |
| 2018 | $1,381 | $16,670 | $2,950 | $13,720 |
| 2017 | $1,388 | $16,670 | $2,950 | $13,720 |
| 2016 | $1,023 | $13,830 | $2,150 | $11,680 |
| 2015 | $1,019 | $13,830 | $2,150 | $11,680 |
| 2014 | $921 | $12,190 | $2,390 | $9,800 |
Source: Public Records
Map
Nearby Homes
- 2010 46th Ave Unit 10
- 2018 42nd Ave
- 2302 42nd Avenue Ct
- 2309 42nd Avenue Ct
- 1814 102nd Ave Ct
- 4672 W 20th Street Rd Unit 4-412
- 4672 W 20th Street Rd Unit 10-1012
- 4672 W 20th Street Rd Unit 2125
- 1879 43rd Ave
- 1910 45th Ave
- 4609 20th
- 3949 W 19th Street Ln
- 1639 43rd Ave
- 4467 W 17th St
- 4409 Centerplace Dr
- 4479 W 17th St
- 2402 49th Ave Ct Unit 5
- 2402 49th Ave Ct Unit 27
- 2402 49th Ave Ct Unit 54
- 1534 43rd Ave
Your Personal Tour Guide
Ask me questions while you tour the home.