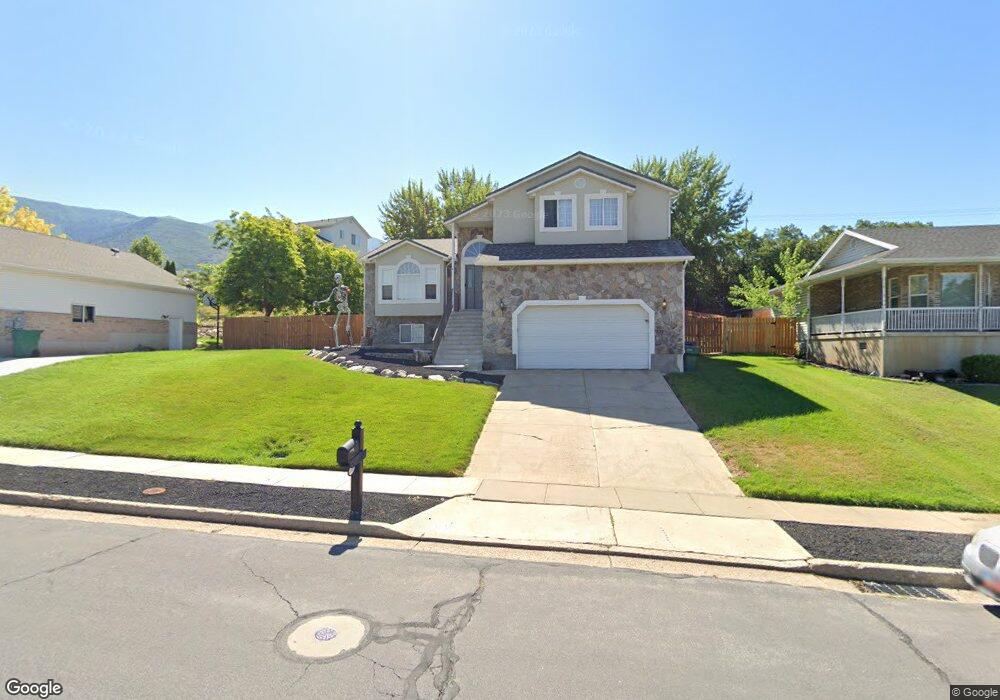
2148 E 3100 N Layton, UT 84040
Estimated Value: $561,000 - $669,000
5
Beds
3
Baths
2,617
Sq Ft
$227/Sq Ft
Est. Value
About This Home
This home is located at 2148 E 3100 N, Layton, UT 84040 and is currently estimated at $595,159, approximately $227 per square foot. 2148 E 3100 N is a home located in Davis County with nearby schools including Mountain View Elementary School, North Layton Junior High School, and Northridge High School.
Ownership History
Date
Name
Owned For
Owner Type
Purchase Details
Closed on
Apr 10, 2009
Sold by
Gonzalez David and Macmonagle Laura
Bought by
Gonzalez David A and Gonzalez Laura M
Current Estimated Value
Home Financials for this Owner
Home Financials are based on the most recent Mortgage that was taken out on this home.
Original Mortgage
$145,000
Interest Rate
4.72%
Mortgage Type
New Conventional
Purchase Details
Closed on
Oct 31, 2002
Sold by
Beecher Michelle
Bought by
Gonzalez David and Macmonagle Laura
Home Financials for this Owner
Home Financials are based on the most recent Mortgage that was taken out on this home.
Original Mortgage
$153,250
Interest Rate
5.99%
Create a Home Valuation Report for This Property
The Home Valuation Report is an in-depth analysis detailing your home's value as well as a comparison with similar homes in the area
Home Values in the Area
Average Home Value in this Area
Purchase History
| Date | Buyer | Sale Price | Title Company |
|---|---|---|---|
| Gonzalez David A | -- | Hickman Land Title Co | |
| Gonzalez David | -- | Bonneville Title Company Inc | |
| Beecher Michelle | -- | Bonneville Title Company Inc |
Source: Public Records
Mortgage History
| Date | Status | Borrower | Loan Amount |
|---|---|---|---|
| Closed | Gonzalez David A | $145,000 | |
| Closed | Gonzalez David | $153,250 |
Source: Public Records
Tax History
| Year | Tax Paid | Tax Assessment Tax Assessment Total Assessment is a certain percentage of the fair market value that is determined by local assessors to be the total taxable value of land and additions on the property. | Land | Improvement |
|---|---|---|---|---|
| 2025 | $2,683 | $281,600 | $132,606 | $148,994 |
| 2024 | $2,569 | $271,700 | $154,969 | $116,731 |
| 2023 | $2,538 | $473,000 | $153,609 | $319,391 |
| 2022 | $2,663 | $269,500 | $81,670 | $187,830 |
| 2021 | $2,484 | $375,000 | $131,639 | $243,361 |
| 2020 | $2,265 | $328,000 | $106,080 | $221,920 |
| 2019 | $2,228 | $316,000 | $108,382 | $207,618 |
| 2018 | $2,016 | $287,000 | $107,032 | $179,968 |
| 2016 | $1,821 | $133,760 | $49,447 | $84,313 |
| 2015 | $1,794 | $125,125 | $49,447 | $75,678 |
| 2014 | $1,607 | $114,595 | $42,997 | $71,598 |
| 2013 | -- | $115,265 | $31,283 | $83,982 |
Source: Public Records
Map
Nearby Homes
- 3232 N Redtail Way
- 2353 Canyon View Dr
- 1935 Deere Valley Dr
- 1827 E Whitetail Dr
- 1821 E Whitetail Way
- 1785 E 2825 N
- 1731 E 2825 N
- 2597 N 2300 E
- 2826 N 1600 E
- 3176 N 1450 E
- 2340 N 2050 E
- 1447 E 2700 N
- 3142 E Thorley Dr
- 1321 E 3125 N
- 2273 N 1975 E
- 2569 N 2900 E
- 3297 N Layton Ridge Dr
- 1266 E 3125 N
- 2202 N 2300 E
- 1241 E 3075 N
- 2142 E 3100 N
- 2168 E 3100 N
- 3095 N 2200 E
- 2132 E 3100 N
- 2135 E 3100 N
- 2157 E 3100 N
- 1985 E 2900 N
- 2102 E 3100 N Unit 103
- 2173 E 3100 N
- 2202 E 3100 N
- 2155 E 3025 N
- 2152 E 3025 N
- 3102 N Broadwing Dr Unit 1
- 3096 N 2200 E Unit 63
- 3096 N 2200 E
- 3094 N 2200 E
- 2163 E 3025 N
- 2158 E 3225 N
- 2080 E 3100 N Unit 102
- 2080 E 3100 N
Your Personal Tour Guide
Ask me questions while you tour the home.