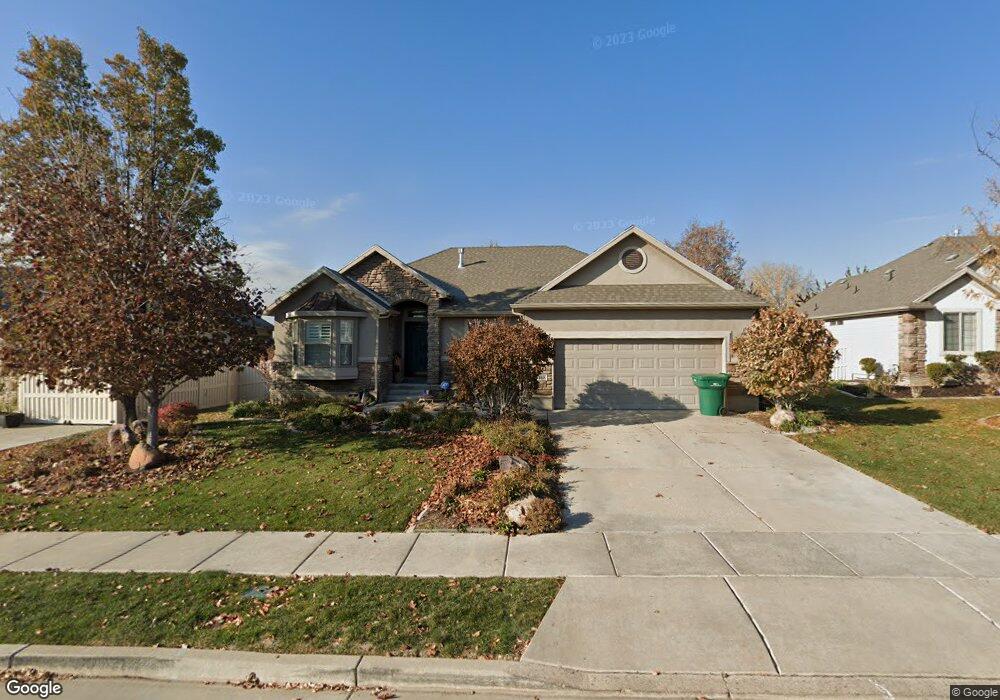
2148 S 275 E Clearfield, UT 84015
Estimated Value: $566,000 - $595,000
4
Beds
3
Baths
3,135
Sq Ft
$185/Sq Ft
Est. Value
About This Home
This home is located at 2148 S 275 E, Clearfield, UT 84015 and is currently estimated at $579,333, approximately $184 per square foot. 2148 S 275 E is a home located in Davis County with nearby schools including Antelope Elementary School, North Davis Junior High School, and Clearfield High School.
Ownership History
Date
Name
Owned For
Owner Type
Purchase Details
Closed on
Oct 30, 2017
Sold by
Holm Stephen K and Holm Melanie N
Bought by
Christensen Allen
Current Estimated Value
Home Financials for this Owner
Home Financials are based on the most recent Mortgage that was taken out on this home.
Original Mortgage
$328,605
Outstanding Balance
$274,551
Interest Rate
3.83%
Mortgage Type
New Conventional
Estimated Equity
$304,782
Purchase Details
Closed on
Mar 7, 2006
Sold by
Gmw Development Inc
Bought by
Holm Stephen K and Holm Melanie N
Home Financials for this Owner
Home Financials are based on the most recent Mortgage that was taken out on this home.
Original Mortgage
$233,190
Interest Rate
6.08%
Mortgage Type
Fannie Mae Freddie Mac
Create a Home Valuation Report for This Property
The Home Valuation Report is an in-depth analysis detailing your home's value as well as a comparison with similar homes in the area
Home Values in the Area
Average Home Value in this Area
Purchase History
| Date | Buyer | Sale Price | Title Company |
|---|---|---|---|
| Christensen Allen | -- | Mountain View Title | |
| Holm Stephen K | -- | Cottonwood Title Ins Agency |
Source: Public Records
Mortgage History
| Date | Status | Borrower | Loan Amount |
|---|---|---|---|
| Open | Christensen Allen | $328,605 | |
| Previous Owner | Holm Stephen K | $233,190 |
Source: Public Records
Tax History
| Year | Tax Paid | Tax Assessment Tax Assessment Total Assessment is a certain percentage of the fair market value that is determined by local assessors to be the total taxable value of land and additions on the property. | Land | Improvement |
|---|---|---|---|---|
| 2025 | $3,406 | $305,250 | $76,666 | $228,584 |
| 2024 | $3,302 | $298,100 | $73,264 | $224,836 |
| 2023 | $3,139 | $520,000 | $116,798 | $403,202 |
| 2022 | $3,388 | $303,600 | $66,466 | $237,134 |
| 2021 | $3,095 | $419,000 | $72,922 | $346,078 |
| 2020 | $2,685 | $361,000 | $61,753 | $299,247 |
| 2019 | $2,539 | $337,000 | $63,159 | $273,841 |
| 2018 | $2,405 | $311,000 | $56,060 | $254,940 |
| 2016 | $1,981 | $133,925 | $22,543 | $111,382 |
| 2015 | $1,953 | $125,895 | $22,543 | $103,352 |
| 2014 | $2,035 | $132,955 | $22,543 | $110,412 |
| 2013 | -- | $110,840 | $37,125 | $73,715 |
Source: Public Records
Map
Nearby Homes
- 195 E 2325 S
- 1250 N 2925 W
- 1969 S 575 E
- 2345 S Main St
- 460 E 1700 S Unit 1 & 2
- 1877 S 725 E
- 2480 S Main St
- 3250 W 1075 N
- 906 E Sam Cir
- 1186 N 2425 W
- 369 W 1900 S
- 1685 S 245 W
- 1141 N 2275 W
- 3389 W Gordon Ave
- 816 N 2700 W
- 1870 N Celia Way
- 1876 W 1575 N Unit 237
- 1916 N Celia Way
- 1570 N 1875 W Unit 242
- 1570 N 1875 W
Your Personal Tour Guide
Ask me questions while you tour the home.