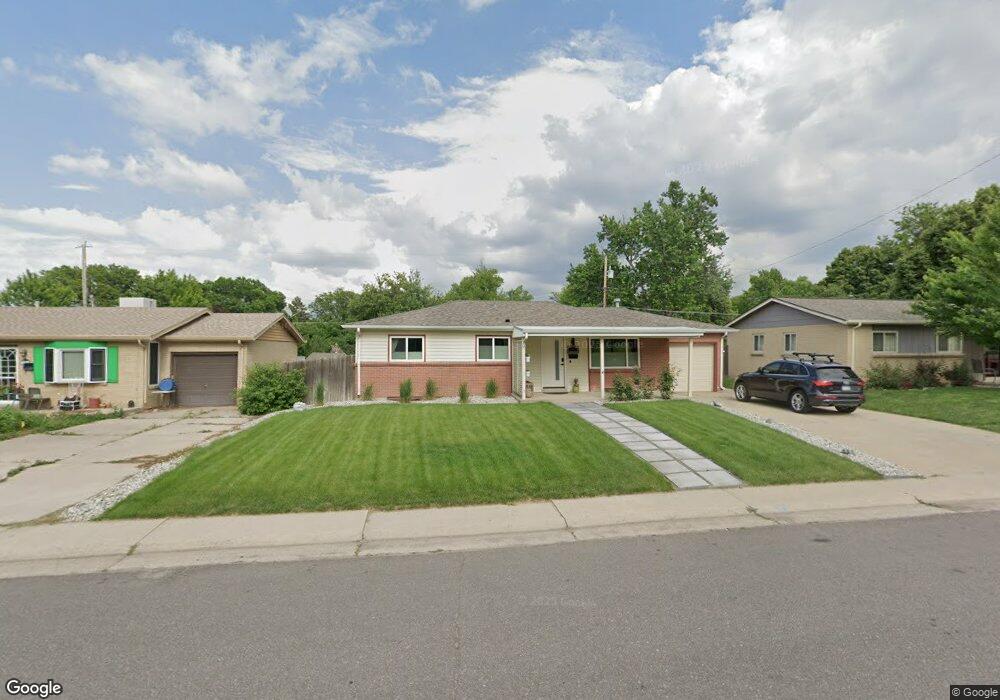
2148 S Patton Ct Denver, CO 80219
Harvey Park NeighborhoodEstimated Value: $518,914 - $570,000
3
Beds
2
Baths
2,082
Sq Ft
$264/Sq Ft
Est. Value
About This Home
This home is located at 2148 S Patton Ct, Denver, CO 80219 and is currently estimated at $550,229, approximately $264 per square foot. 2148 S Patton Ct is a home located in Denver County with nearby schools including Doull Elementary School, Bear Valley International School, and Excel Academy.
Ownership History
Date
Name
Owned For
Owner Type
Purchase Details
Closed on
May 25, 2022
Sold by
Aspen Investment Realty Llc
Bought by
Fitzpatrick Bridget
Current Estimated Value
Purchase Details
Closed on
Apr 20, 2021
Sold by
United Colorado Llc
Bought by
Aspen Investment Realty Llc
Purchase Details
Closed on
Apr 19, 2021
Sold by
Gotchey Justin T and Gotchey Timothy G
Bought by
United Colorado Llc
Purchase Details
Closed on
Sep 9, 2016
Sold by
Tran Mike Tap and Pham Susan Hue
Bought by
Gotchey Justin T and Gotchey Timothy G
Home Financials for this Owner
Home Financials are based on the most recent Mortgage that was taken out on this home.
Original Mortgage
$288,000
Interest Rate
3.48%
Mortgage Type
New Conventional
Purchase Details
Closed on
May 24, 2002
Sold by
Hacker Stanley J
Bought by
Tran Mike Tap and Pham Susan Hue
Home Financials for this Owner
Home Financials are based on the most recent Mortgage that was taken out on this home.
Original Mortgage
$185,000
Interest Rate
6.92%
Create a Home Valuation Report for This Property
The Home Valuation Report is an in-depth analysis detailing your home's value as well as a comparison with similar homes in the area
Home Values in the Area
Average Home Value in this Area
Purchase History
| Date | Buyer | Sale Price | Title Company |
|---|---|---|---|
| Fitzpatrick Bridget | -- | None Listed On Document | |
| Aspen Investment Realty Llc | $469,900 | Tiago National Title Llc | |
| United Colorado Llc | $463,800 | Tiago National Title Llc | |
| Gotchey Justin T | $320,000 | Land Title Guarantee | |
| Tran Mike Tap | $215,000 | -- |
Source: Public Records
Mortgage History
| Date | Status | Borrower | Loan Amount |
|---|---|---|---|
| Previous Owner | Gotchey Justin T | $288,000 | |
| Previous Owner | Tran Mike Tap | $185,000 |
Source: Public Records
Tax History Compared to Growth
Tax History
| Year | Tax Paid | Tax Assessment Tax Assessment Total Assessment is a certain percentage of the fair market value that is determined by local assessors to be the total taxable value of land and additions on the property. | Land | Improvement |
|---|---|---|---|---|
| 2024 | $2,829 | $35,720 | $2,810 | $32,910 |
| 2023 | $2,768 | $35,720 | $2,810 | $32,910 |
| 2022 | $2,204 | $27,710 | $6,730 | $20,980 |
| 2021 | $2,128 | $28,520 | $6,930 | $21,590 |
| 2020 | $1,933 | $26,050 | $6,470 | $19,580 |
| 2019 | $1,879 | $26,050 | $6,470 | $19,580 |
| 2018 | $1,590 | $20,550 | $5,580 | $14,970 |
| 2017 | $1,585 | $20,550 | $5,580 | $14,970 |
| 2016 | $1,411 | $17,300 | $5,142 | $12,158 |
| 2015 | $1,352 | $17,300 | $5,142 | $12,158 |
| 2014 | $1,327 | $15,980 | $2,571 | $13,409 |
Source: Public Records
Map
Nearby Homes
- 2236 S Osceola St
- 2046 S Quitman St
- 2271 S Quitman Way
- 2081 S King St
- 2313 S Raleigh St
- 2370 S Meade St
- 3440 W Evans Ave
- 1888 S Michigan Way
- 2285 S Knox Ct
- 1863 S Lowell Blvd
- 2455 S Newton St
- 1910 S King St
- 1817 S Perry Way
- 1845 S Mabry Way
- 1910 S Knox Ct
- 2514 S Raleigh St
- 2516 S Stuart St
- 2380 S Julian St
- 2562 S Quitman St
- 4760 W Evans Ave
- 2158 S Patton Ct
- 2138 S Patton Ct
- 2147 S Osceola St
- 2157 S Osceola St
- 2128 S Patton Ct
- 2168 S Patton Ct
- 2137 S Osceola St
- 2167 S Osceola St
- 2178 S Patton Ct
- 2177 S Osceola St
- 2156 S Osceola St
- 2146 S Osceola St
- 2188 S Patton Ct
- 2136 S Osceola St
- 2166 S Osceola St
- 2187 S Osceola St
- 2176 S Osceola St
- 2126 S Osceola St
- 2186 S Osceola St
- 2116 S Osceola St