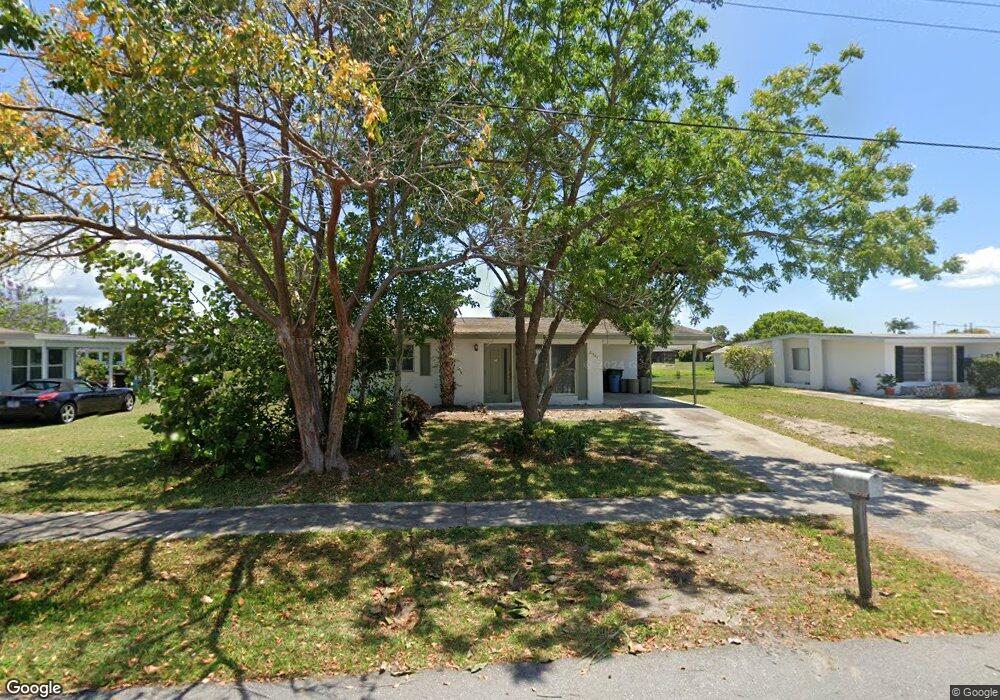
21483 Gladis Ave Port Charlotte, FL 33952
Estimated Value: $154,000 - $191,000
2
Beds
1
Bath
951
Sq Ft
$181/Sq Ft
Est. Value
About This Home
This home is located at 21483 Gladis Ave, Port Charlotte, FL 33952 and is currently estimated at $172,275, approximately $181 per square foot. 21483 Gladis Ave is a home located in Charlotte County with nearby schools including Neil Armstrong Elementary School, Port Charlotte Middle School, and Port Charlotte High School.
Ownership History
Date
Name
Owned For
Owner Type
Purchase Details
Closed on
Dec 4, 2012
Sold by
County Of Charlotte
Bought by
Williams Lauranna L and Smith Thomas J
Current Estimated Value
Purchase Details
Closed on
Jun 25, 2004
Sold by
Witter Steve and Ward Jack
Bought by
Preston Kathryn
Purchase Details
Closed on
Apr 6, 2004
Sold by
Freirich Marilyn J
Bought by
Witter Steve and Ward Jack
Purchase Details
Closed on
Mar 8, 2000
Sold by
Freirich Kevin J and Freirich Marilyn J
Bought by
Freirich Marilyn J
Purchase Details
Closed on
Jun 27, 1997
Sold by
Freirich Janet L
Bought by
Freirich Kevin J and Freirich Marilyn J
Home Financials for this Owner
Home Financials are based on the most recent Mortgage that was taken out on this home.
Original Mortgage
$42,800
Interest Rate
7.93%
Mortgage Type
VA
Create a Home Valuation Report for This Property
The Home Valuation Report is an in-depth analysis detailing your home's value as well as a comparison with similar homes in the area
Home Values in the Area
Average Home Value in this Area
Purchase History
| Date | Buyer | Sale Price | Title Company |
|---|---|---|---|
| Williams Lauranna L | $25,200 | None Available | |
| Preston Kathryn | $84,900 | Aaction Title Agency Inc | |
| Witter Steve | $50,000 | Aaction Title Agency Inc | |
| Freirich Marilyn J | -- | -- | |
| Freirich Kevin J | $42,000 | -- |
Source: Public Records
Mortgage History
| Date | Status | Borrower | Loan Amount |
|---|---|---|---|
| Previous Owner | Freirich Kevin J | $42,800 |
Source: Public Records
Tax History Compared to Growth
Tax History
| Year | Tax Paid | Tax Assessment Tax Assessment Total Assessment is a certain percentage of the fair market value that is determined by local assessors to be the total taxable value of land and additions on the property. | Land | Improvement |
|---|---|---|---|---|
| 2024 | $2,244 | $145,267 | $19,125 | $126,142 |
| 2023 | $2,244 | $72,648 | $0 | $0 |
| 2022 | $2,241 | $116,584 | $14,344 | $102,240 |
| 2021 | $1,952 | $77,366 | $9,053 | $68,313 |
| 2020 | $1,857 | $75,939 | $8,288 | $67,651 |
| 2019 | $1,721 | $72,354 | $8,288 | $64,066 |
| 2018 | $1,534 | $68,682 | $8,160 | $60,522 |
| 2017 | $1,429 | $59,016 | $7,140 | $51,876 |
| 2016 | $1,348 | $48,439 | $0 | $0 |
| 2015 | $1,239 | $44,035 | $0 | $0 |
| 2014 | $1,155 | $40,104 | $0 | $0 |
Source: Public Records
Map
Nearby Homes
- 2209 Easy St
- 21427 Gladis Ave
- 21427 Gladis Ave Unit 10
- 21539 Gladis Ave
- 21530 Glendale Ave
- 2201 Birchcrest Blvd
- 2230 Harbor Blvd
- 2144 Harbor Blvd
- 2199 Hariet St
- 21962 Cellini Ave
- 21899 Cellini Ave
- 1603 Scotten St
- 21354 Austin Ave
- 1578 Adrian St
- 21330 Meehan Ave
- 22147 Catherine Ave
- 1586 Scotten St
- 2089 Hariet St
- 2116 Hanson St
- 22194 Catherine Ave
- 21491 Gladis Ave
- 21475 Gladis Ave
- 21499 Gladis Ave
- 21467 Gladis Ave
- 21482 Gladis Ave
- 21490 Gladis Ave
- 21474 Gladis Ave
- 21498 Gladis Ave
- 21507 Gladis Ave
- 21459 Gladis Ave
- 2193 Easy St
- 2185 Easy St
- 21466 Gladis Ave
- 2201 Easy St
- 21506 Avenue
- 21506 Gladis Ave
- 2177 Easy St
- 21483 Meehan Ave
- 21491 Meehan Ave
- 21499 Meehan Ave