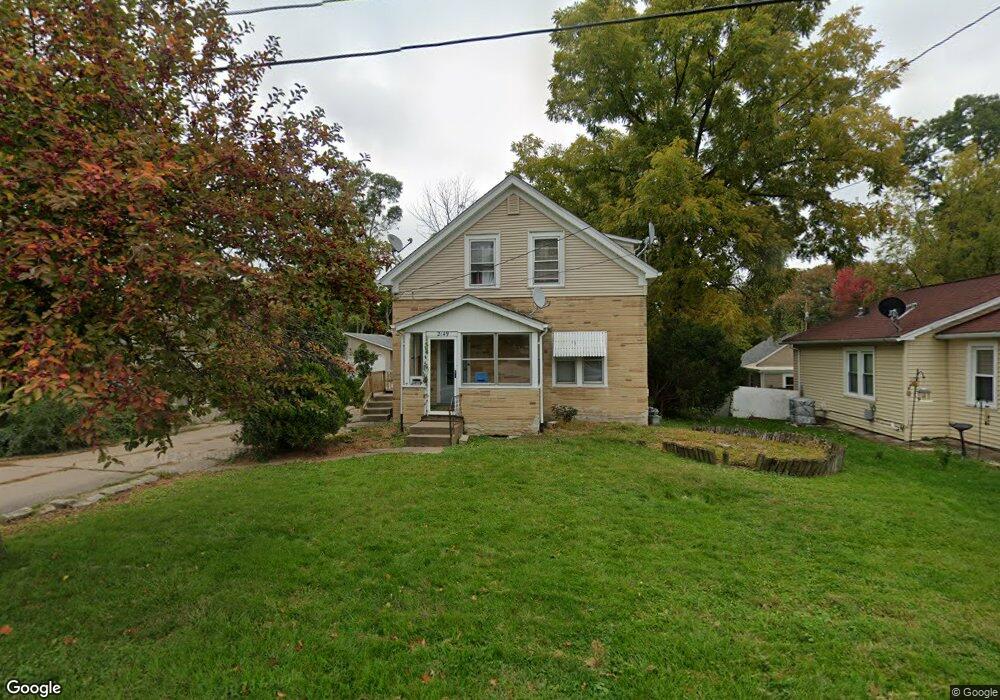
2149 32nd St Unit 2149 1/2 Rock Island, IL 61201
East Central Rock Island NeighborhoodEstimated Value: $107,744 - $146,000
--
Bed
--
Bath
1,155
Sq Ft
$109/Sq Ft
Est. Value
About This Home
This home is located at 2149 32nd St Unit 2149 1/2, Rock Island, IL 61201 and is currently estimated at $125,436, approximately $108 per square foot. 2149 32nd St Unit 2149 1/2 is a home located in Rock Island County with nearby schools including Denkmann Elementary School, Washington Junior High School, and Rock Island High School.
Ownership History
Date
Name
Owned For
Owner Type
Purchase Details
Closed on
Dec 22, 2021
Sold by
Gomez Jeremy M
Bought by
Pr Jitta Ny Inc
Current Estimated Value
Purchase Details
Closed on
Jun 1, 1993
Create a Home Valuation Report for This Property
The Home Valuation Report is an in-depth analysis detailing your home's value as well as a comparison with similar homes in the area
Home Values in the Area
Average Home Value in this Area
Purchase History
| Date | Buyer | Sale Price | Title Company |
|---|---|---|---|
| Pr Jitta Ny Inc | $104,000 | None Listed On Document | |
| -- | $39,500 | -- |
Source: Public Records
Tax History Compared to Growth
Tax History
| Year | Tax Paid | Tax Assessment Tax Assessment Total Assessment is a certain percentage of the fair market value that is determined by local assessors to be the total taxable value of land and additions on the property. | Land | Improvement |
|---|---|---|---|---|
| 2024 | $4,911 | $48,794 | $8,741 | $40,053 |
| 2023 | $4,911 | $44,642 | $7,997 | $36,645 |
| 2022 | $4,284 | $41,878 | $7,502 | $34,376 |
| 2021 | $3,776 | $41,770 | $7,124 | $34,646 |
| 2020 | $3,679 | $40,632 | $6,930 | $33,702 |
| 2019 | $3,810 | $40,229 | $6,861 | $33,368 |
| 2018 | $3,810 | $36,599 | $6,242 | $30,357 |
| 2017 | $3,704 | $35,383 | $6,035 | $29,348 |
| 2016 | $3,593 | $35,383 | $6,035 | $29,348 |
| 2015 | $2,981 | $35,383 | $6,035 | $29,348 |
| 2014 | $731 | $34,952 | $5,962 | $28,990 |
| 2013 | $731 | $34,952 | $5,962 | $28,990 |
Source: Public Records
Map
Nearby Homes