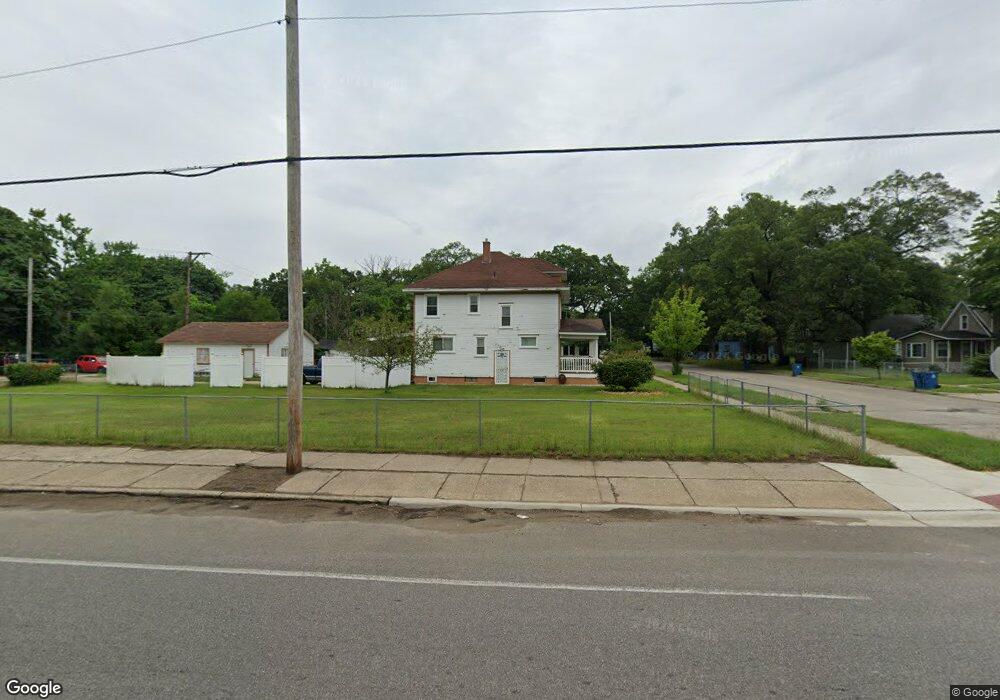
2149 6th St Muskegon, MI 49444
Estimated Value: $104,000 - $131,813
4
Beds
2
Baths
1,800
Sq Ft
$64/Sq Ft
Est. Value
About This Home
This home is located at 2149 6th St, Muskegon, MI 49444 and is currently estimated at $115,453, approximately $64 per square foot. 2149 6th St is a home located in Muskegon County with nearby schools including Dr. Martin Luther King Academy, Muskegon Heights Academy, and Muskegon Covenant Academy.
Ownership History
Date
Name
Owned For
Owner Type
Purchase Details
Closed on
Oct 4, 2008
Sold by
Jackson Belinda L and Jackson Harel J
Bought by
Franklin Jesse and Franklin Linda
Current Estimated Value
Purchase Details
Closed on
Feb 14, 2006
Sold by
Hsbc Bank Usa
Bought by
Franklin Jessie R and Franklin Linda J
Home Financials for this Owner
Home Financials are based on the most recent Mortgage that was taken out on this home.
Original Mortgage
$41,097
Interest Rate
6.2%
Mortgage Type
Fannie Mae Freddie Mac
Purchase Details
Closed on
Feb 4, 2005
Sold by
Chapman Ahmed Jamal and Chapman Jackie
Bought by
Hsbc Bank Usa and Citigroup Mortgage Loan Trust Inc Asset
Create a Home Valuation Report for This Property
The Home Valuation Report is an in-depth analysis detailing your home's value as well as a comparison with similar homes in the area
Home Values in the Area
Average Home Value in this Area
Purchase History
| Date | Buyer | Sale Price | Title Company |
|---|---|---|---|
| Franklin Jesse | $4,500 | None Available | |
| Franklin Jessie R | $41,097 | Rels Title | |
| Hsbc Bank Usa | $44,551 | -- |
Source: Public Records
Mortgage History
| Date | Status | Borrower | Loan Amount |
|---|---|---|---|
| Previous Owner | Franklin Jessie R | $41,097 |
Source: Public Records
Tax History Compared to Growth
Tax History
| Year | Tax Paid | Tax Assessment Tax Assessment Total Assessment is a certain percentage of the fair market value that is determined by local assessors to be the total taxable value of land and additions on the property. | Land | Improvement |
|---|---|---|---|---|
| 2025 | $1,068 | $50,400 | $0 | $0 |
| 2024 | $895 | $34,000 | $0 | $0 |
| 2023 | $1,006 | $27,600 | $0 | $0 |
| 2022 | $1,263 | $26,200 | $0 | $0 |
| 2021 | $1,227 | $24,300 | $0 | $0 |
| 2020 | $1,212 | $21,300 | $0 | $0 |
| 2019 | $1,190 | $23,700 | $0 | $0 |
| 2018 | $1,162 | $21,100 | $0 | $0 |
| 2017 | $1,059 | $20,900 | $0 | $0 |
| 2016 | $777 | $19,500 | $0 | $0 |
| 2015 | -- | $23,900 | $0 | $0 |
| 2014 | -- | $25,800 | $0 | $0 |
| 2013 | -- | $25,100 | $0 | $0 |
Source: Public Records
Map
Nearby Homes