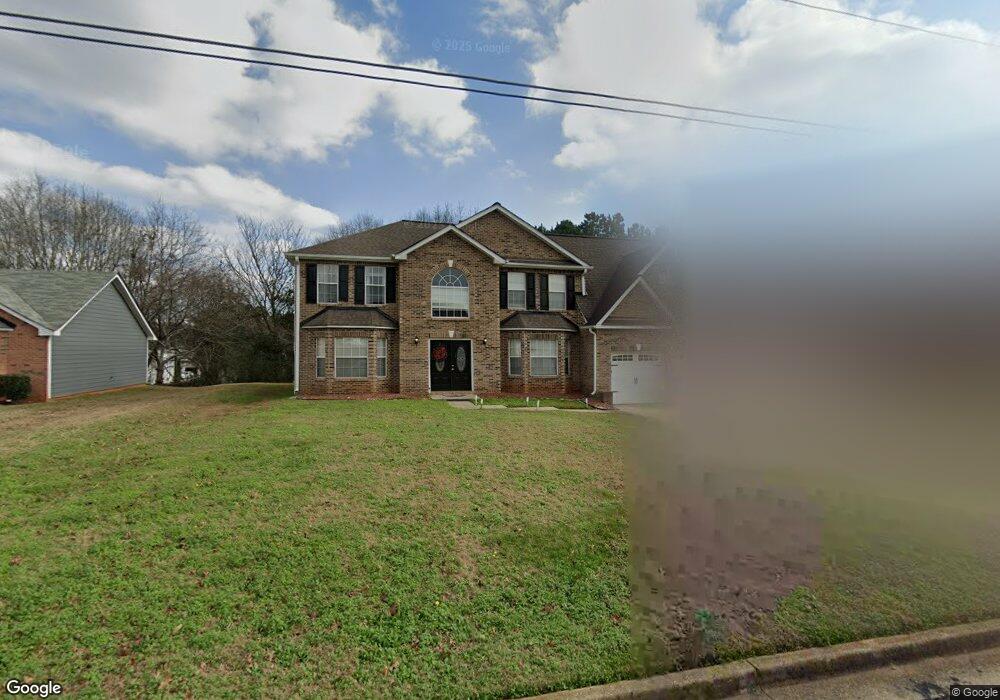
2149 Eagles Nest Cir Decatur, GA 30035
Southwest DeKalb NeighborhoodEstimated Value: $332,307 - $375,000
About This Home
Please note, our homes are available on a first-come, first-serve basis and are not reserved until the holding fee agreement is signed and the holding fee is paid by the primary applicant.
This home features Progress Smart Home - Progress Residential's smart home app, which allows you to control the home securely from any of your devices. Learn more at
This home is priced to rent and won't be around for long. Apply now, while the current residents are preparing to move out, or call to arrange a meeting with your local Progress Residential leasing specialist today.
Interested in this home? You clearly have exceptional taste. Like all our homes, this one features: a great location in a desirable neighborhood, a comfortable layout with good-sized bedrooms and bathrooms, a great kitchen with plenty of counter and cabinet space, many updated and upgraded features, central HVAC and programmable thermostat, garage and a spacious yard, and it's pet friendly. Call or click to schedule a tour or submit your application online at today!
At Progress Residential® we're here to serve you and make your time in the home as convenient as possible. We offer: a safe and secure online portal where you can place maintenance requests and pay online, multiple payment options, 24/7 Emergency maintenance response team available even on weekends, and well-maintained homes with regular preventative maintenance.
Ownership History
Purchase Details
Purchase Details
Purchase Details
Home Financials for this Owner
Home Financials are based on the most recent Mortgage that was taken out on this home.Home Values in the Area
Average Home Value in this Area
Purchase History
| Date | Buyer | Sale Price | Title Company |
|---|---|---|---|
| Home Sfr Borrower Iv Llc | $206,890 | -- | |
| Mcf Sfr Holdings 1 Llc | $131,000 | -- | |
| Wiley Kenneth L | $181,900 | -- |
Mortgage History
| Date | Status | Borrower | Loan Amount |
|---|---|---|---|
| Previous Owner | Wiley Kenneth L | $179,000 |
Property History
| Date | Event | Price | List to Sale | Price per Sq Ft |
|---|---|---|---|---|
| 06/27/2025 06/27/25 | Off Market | $2,665 | -- | -- |
| 06/22/2025 06/22/25 | Price Changed | $2,665 | +0.2% | $1 / Sq Ft |
| 06/19/2025 06/19/25 | Price Changed | $2,660 | +0.2% | $1 / Sq Ft |
| 06/17/2025 06/17/25 | Price Changed | $2,655 | -1.8% | $1 / Sq Ft |
| 06/16/2025 06/16/25 | Price Changed | $2,705 | +0.4% | $1 / Sq Ft |
| 06/11/2025 06/11/25 | Price Changed | $2,695 | +0.2% | $1 / Sq Ft |
| 06/10/2025 06/10/25 | Price Changed | $2,690 | -1.8% | $1 / Sq Ft |
| 06/08/2025 06/08/25 | Price Changed | $2,740 | +0.2% | $1 / Sq Ft |
| 06/06/2025 06/06/25 | Price Changed | $2,735 | +0.2% | $1 / Sq Ft |
| 06/04/2025 06/04/25 | Price Changed | $2,730 | +0.2% | $1 / Sq Ft |
| 06/03/2025 06/03/25 | Price Changed | $2,725 | -1.8% | $1 / Sq Ft |
| 06/02/2025 06/02/25 | Price Changed | $2,775 | +0.4% | $1 / Sq Ft |
| 05/28/2025 05/28/25 | Price Changed | $2,765 | -23.4% | $1 / Sq Ft |
| 05/25/2025 05/25/25 | Price Changed | $3,610 | 0.0% | $1 / Sq Ft |
| 05/25/2025 05/25/25 | For Rent | $3,610 | +37.3% | -- |
| 02/03/2025 02/03/25 | Off Market | $2,630 | -- | -- |
| 01/19/2025 01/19/25 | Price Changed | $2,630 | +1.9% | $1 / Sq Ft |
| 01/18/2025 01/18/25 | Price Changed | $2,580 | +1.8% | $1 / Sq Ft |
| 01/17/2025 01/17/25 | Price Changed | $2,535 | +2.0% | $1 / Sq Ft |
| 01/15/2025 01/15/25 | Price Changed | $2,485 | +1.8% | $1 / Sq Ft |
| 01/14/2025 01/14/25 | For Rent | $2,440 | 0.0% | -- |
| 12/17/2024 12/17/24 | Off Market | $2,440 | -- | -- |
| 12/12/2024 12/12/24 | Price Changed | $2,440 | +0.2% | $1 / Sq Ft |
| 12/11/2024 12/11/24 | Price Changed | $2,435 | -0.2% | $1 / Sq Ft |
| 12/05/2024 12/05/24 | Price Changed | $2,440 | +0.2% | $1 / Sq Ft |
| 12/03/2024 12/03/24 | Price Changed | $2,435 | -0.4% | $1 / Sq Ft |
| 11/28/2024 11/28/24 | Price Changed | $2,445 | -2.0% | $1 / Sq Ft |
| 11/25/2024 11/25/24 | Price Changed | $2,495 | -1.0% | $1 / Sq Ft |
| 11/24/2024 11/24/24 | Price Changed | $2,520 | -1.0% | $1 / Sq Ft |
| 11/20/2024 11/20/24 | Price Changed | $2,545 | -3.4% | $1 / Sq Ft |
| 11/16/2024 11/16/24 | Price Changed | $2,635 | +0.6% | $1 / Sq Ft |
| 11/13/2024 11/13/24 | Price Changed | $2,620 | -0.9% | $1 / Sq Ft |
| 11/11/2024 11/11/24 | Price Changed | $2,645 | +0.2% | $1 / Sq Ft |
| 11/10/2024 11/10/24 | Price Changed | $2,640 | -1.5% | $1 / Sq Ft |
| 11/08/2024 11/08/24 | Price Changed | $2,680 | -0.2% | $1 / Sq Ft |
| 11/07/2024 11/07/24 | Price Changed | $2,685 | +0.2% | $1 / Sq Ft |
| 11/06/2024 11/06/24 | Price Changed | $2,680 | -3.8% | $1 / Sq Ft |
| 11/04/2024 11/04/24 | Price Changed | $2,785 | +0.2% | $1 / Sq Ft |
| 11/03/2024 11/03/24 | Price Changed | $2,780 | +0.5% | $1 / Sq Ft |
| 11/02/2024 11/02/24 | Price Changed | $2,765 | -0.2% | $1 / Sq Ft |
| 11/01/2024 11/01/24 | Price Changed | $2,770 | +4.5% | $1 / Sq Ft |
| 10/31/2024 10/31/24 | Price Changed | $2,650 | -0.2% | $1 / Sq Ft |
| 10/30/2024 10/30/24 | Price Changed | $2,655 | +0.2% | $1 / Sq Ft |
| 10/29/2024 10/29/24 | Price Changed | $2,650 | -0.2% | $1 / Sq Ft |
| 10/28/2024 10/28/24 | Price Changed | $2,655 | +0.2% | $1 / Sq Ft |
| 10/27/2024 10/27/24 | Price Changed | $2,650 | -0.4% | $1 / Sq Ft |
| 10/26/2024 10/26/24 | Price Changed | $2,660 | +0.4% | $1 / Sq Ft |
| 10/25/2024 10/25/24 | Price Changed | $2,650 | -0.2% | $1 / Sq Ft |
| 10/24/2024 10/24/24 | Price Changed | $2,655 | -0.2% | $1 / Sq Ft |
| 10/19/2024 10/19/24 | Price Changed | $2,660 | -26.3% | $1 / Sq Ft |
| 10/17/2024 10/17/24 | For Rent | $3,610 | -- | -- |
Tax History
| Year | Tax Paid | Tax Assessment Tax Assessment Total Assessment is a certain percentage of the fair market value that is determined by local assessors to be the total taxable value of land and additions on the property. | Land | Improvement |
|---|---|---|---|---|
| 2025 | $6,129 | $129,840 | $16,000 | $113,840 |
| 2024 | $6,184 | $131,080 | $16,000 | $115,080 |
| 2023 | $6,184 | $133,840 | $16,000 | $117,840 |
Map
- 2224 Eagles Nest Cir
- 4579 Tudor Castle Dr
- 2320 Highbank Ct
- 2428 Marsh Rabbit Bend
- 5181 Covington Hwy
- 5169 Covington Hwy
- 5159 Covington Hwy
- 2119 Tudor Castle Way
- 4612 Grand Central Pkwy
- 2304 S Hairston Rd
- 1987 Manhattan Pkwy
- 5160 Covington Hwy Unit 18
- 5160 Covington Hwy
- 1830 Broadway St
- 2465 Marsh Rabbit Bend
- 2014 Manhattan Pkwy
- 4421 John Wesley Dr
- 4373 Buckingham Cir
- 2109 Creekview Trail
- 1907 Manhattan Pkwy
- 2153 Eagles Nest Cir
- 2145 Eagles Nest Cir
- 2109 Redwater Dr Unit 3
- 2115 Redwater Dr
- 2157 Eagles Nest Cir
- 2150 Eagles Nest Cir
- 2154 Eagles Nest Cir
- 2103 Redwater Dr
- 2141 Eagles Nest Cir
- 2142 Eagles Nest Cir
- 2120 Redwater Dr Unit 3
- 2158 Eagles Nest Cir
- 2161 Eagles Nest Cir
- 2093 Redwater Dr Unit 3
- 2137 Eagles Nest Cir
- 2138 Eagles Nest Cir
- 4645 Pigeon Island Dr
- 4663 Seagull Cove
- 4668 Seagull Cove
- 2165 Eagles Nest Cir
Ask me questions while you tour the home.