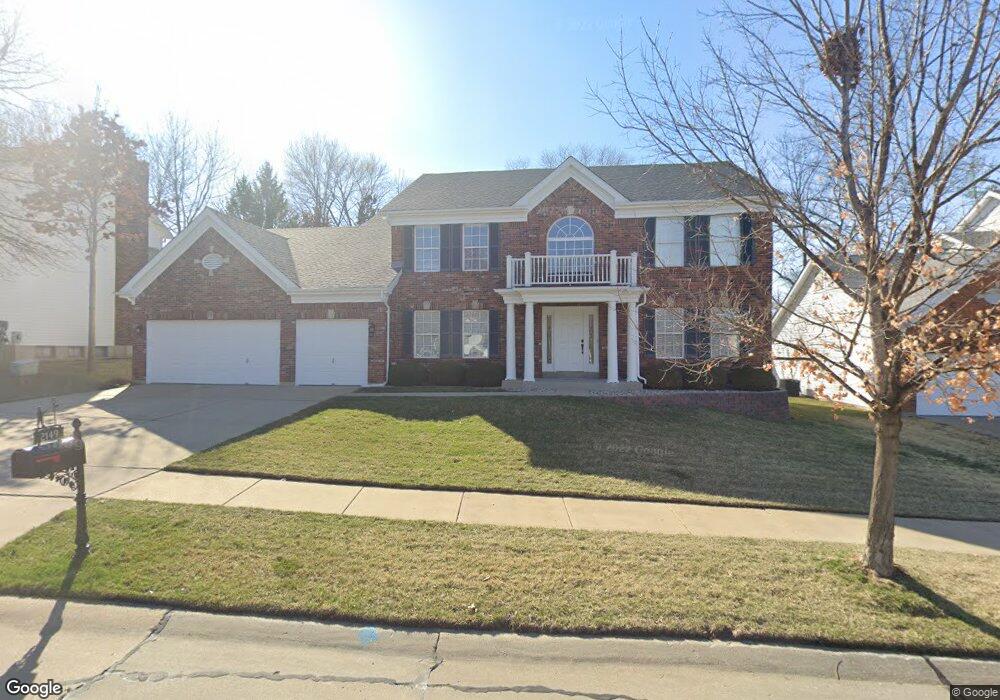
2149 Englewood Terrace Chesterfield, MO 63017
Estimated Value: $627,000 - $759,000
4
Beds
4
Baths
3,120
Sq Ft
$226/Sq Ft
Est. Value
About This Home
This home is located at 2149 Englewood Terrace, Chesterfield, MO 63017 and is currently estimated at $705,650, approximately $226 per square foot. 2149 Englewood Terrace is a home located in St. Louis County with nearby schools including Kehrs Mill Elementary, Crestview Middle School, and Marquette Sr. High School.
Ownership History
Date
Name
Owned For
Owner Type
Purchase Details
Closed on
Jun 18, 2002
Sold by
Ruden Walter and Ruden Patricia
Bought by
Mitchell Michael S and Mitchell Susan C
Current Estimated Value
Home Financials for this Owner
Home Financials are based on the most recent Mortgage that was taken out on this home.
Original Mortgage
$190,000
Outstanding Balance
$80,393
Interest Rate
6.82%
Estimated Equity
$625,257
Purchase Details
Closed on
Jul 15, 1999
Sold by
Glick John W and Glick Cheryl A
Bought by
Ruden Walter and Ruden Patricia
Purchase Details
Closed on
Jan 17, 1997
Sold by
Miceli & Young Investments Llc
Bought by
Glick John W and Glick Cheryl A
Home Financials for this Owner
Home Financials are based on the most recent Mortgage that was taken out on this home.
Original Mortgage
$206,500
Interest Rate
7.57%
Mortgage Type
Balloon
Create a Home Valuation Report for This Property
The Home Valuation Report is an in-depth analysis detailing your home's value as well as a comparison with similar homes in the area
Home Values in the Area
Average Home Value in this Area
Purchase History
| Date | Buyer | Sale Price | Title Company |
|---|---|---|---|
| Mitchell Michael S | $390,000 | -- | |
| Ruden Walter | $339,000 | -- | |
| Glick John W | -- | -- |
Source: Public Records
Mortgage History
| Date | Status | Borrower | Loan Amount |
|---|---|---|---|
| Open | Mitchell Michael S | $190,000 | |
| Previous Owner | Glick John W | $206,500 |
Source: Public Records
Tax History Compared to Growth
Tax History
| Year | Tax Paid | Tax Assessment Tax Assessment Total Assessment is a certain percentage of the fair market value that is determined by local assessors to be the total taxable value of land and additions on the property. | Land | Improvement |
|---|---|---|---|---|
| 2025 | $7,362 | $125,940 | $27,800 | $98,140 |
| 2024 | $7,362 | $105,470 | $20,840 | $84,630 |
| 2023 | $7,362 | $105,470 | $20,840 | $84,630 |
| 2022 | $7,046 | $93,820 | $20,840 | $72,980 |
| 2021 | $6,994 | $93,820 | $20,840 | $72,980 |
| 2020 | $6,659 | $85,140 | $20,840 | $64,300 |
| 2019 | $6,685 | $85,140 | $20,840 | $64,300 |
| 2018 | $6,329 | $75,990 | $17,370 | $58,620 |
| 2017 | $6,179 | $75,990 | $17,370 | $58,620 |
| 2016 | $6,238 | $73,790 | $13,030 | $60,760 |
| 2015 | $6,112 | $73,790 | $13,030 | $60,760 |
| 2014 | $6,743 | $79,150 | $16,680 | $62,470 |
Source: Public Records
Map
Nearby Homes
- 2259 Sycamore Dr
- 15740 Tambour Ct
- 925 Camargo Dr
- 15575 Meadowbrook Circle Ln
- 259 Meadowbrook Country Club Estate
- 258 Meadowbrook Country Club Estate
- 1020 Del Ebro Dr
- 927 Claytonbrook Dr Unit 3
- 917 Claytonbrook Dr Unit 3
- 9 Picardy Hill Dr
- 920 Claytonbrook Dr Unit 3
- 910 Claytonbrook Dr Unit 1
- 15921 Picardy Crest Ct
- 15 Meadowbrook Country Club Estate
- 1019 Claytonbrook Dr Unit 1019
- 407 Lennox Dr
- 1131 Claytonbrook Ct Unit 1131
- 2054 Parasol Dr
- 16053 Hunters Way Dr
- 2130 Willow Way Ct
- 2145 Englewood Terrace
- 2153 Englewood Terrace
- 2288 Hill House Rd
- 2290 Hill House Rd
- 2150 Englewood Terrace
- 2292 Hill House Rd
- 2141 Englewood Terrace
- 2286 Hill House Rd
- 2157 Englewood Terrace
- 2146 Englewood Terrace
- 2294 Hill House Rd
- 2158 Englewood Terrace
- 2284 Hill House Rd
- 2137 Englewood Terrace
- 2161 Englewood Terrace
- 2142 Englewood Terrace
- 2264 Sycamore Dr
- 2296 Hill House Rd
- 2282 Hill House Rd
- 2263 Sycamore Dr