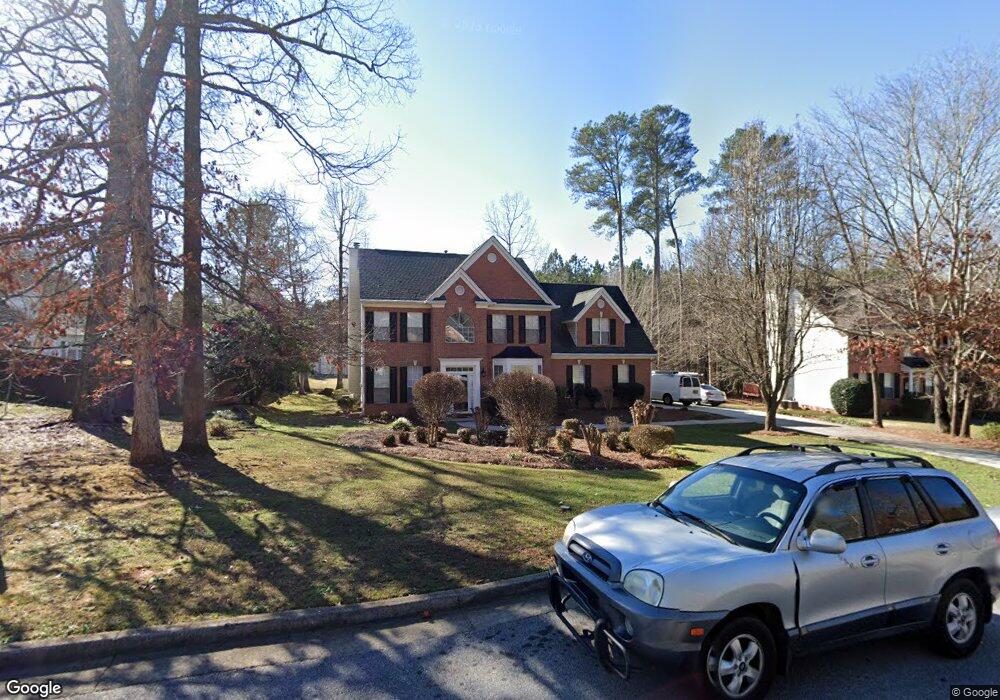
2149 Hedgerow Way Jonesboro, GA 30236
Estimated Value: $334,842 - $379,000
5
Beds
3
Baths
2,560
Sq Ft
$140/Sq Ft
Est. Value
About This Home
This home is located at 2149 Hedgerow Way, Jonesboro, GA 30236 and is currently estimated at $359,461, approximately $140 per square foot. 2149 Hedgerow Way is a home located in Clayton County with nearby schools including Suder Elementary School, M. D. Roberts Middle School, and Jonesboro High School.
Ownership History
Date
Name
Owned For
Owner Type
Purchase Details
Closed on
May 5, 2011
Sold by
Mathis Sharol D
Bought by
Rainey Andrea S
Current Estimated Value
Home Financials for this Owner
Home Financials are based on the most recent Mortgage that was taken out on this home.
Original Mortgage
$108,070
Outstanding Balance
$77,209
Interest Rate
5.5%
Mortgage Type
FHA
Estimated Equity
$282,252
Purchase Details
Closed on
Feb 28, 2005
Sold by
Gibbs Rogelio A
Bought by
Mathis Sharol D
Home Financials for this Owner
Home Financials are based on the most recent Mortgage that was taken out on this home.
Original Mortgage
$200,978
Interest Rate
5.71%
Mortgage Type
New Conventional
Purchase Details
Closed on
Aug 29, 1997
Sold by
John Wieland Homes
Bought by
Caldwell Barbara A and Gibbs Rogelio A
Home Financials for this Owner
Home Financials are based on the most recent Mortgage that was taken out on this home.
Original Mortgage
$177,900
Interest Rate
7.39%
Mortgage Type
VA
Create a Home Valuation Report for This Property
The Home Valuation Report is an in-depth analysis detailing your home's value as well as a comparison with similar homes in the area
Home Values in the Area
Average Home Value in this Area
Purchase History
| Date | Buyer | Sale Price | Title Company |
|---|---|---|---|
| Rainey Andrea S | $112,000 | -- | |
| Mathis Sharol D | $204,200 | -- | |
| Caldwell Barbara A | $177,900 | -- |
Source: Public Records
Mortgage History
| Date | Status | Borrower | Loan Amount |
|---|---|---|---|
| Open | Rainey Andrea S | $108,070 | |
| Previous Owner | Mathis Sharol D | $200,978 | |
| Previous Owner | Caldwell Barbara A | $177,900 |
Source: Public Records
Tax History Compared to Growth
Tax History
| Year | Tax Paid | Tax Assessment Tax Assessment Total Assessment is a certain percentage of the fair market value that is determined by local assessors to be the total taxable value of land and additions on the property. | Land | Improvement |
|---|---|---|---|---|
| 2024 | $4,952 | $135,960 | $9,600 | $126,360 |
| 2023 | $4,707 | $130,360 | $9,600 | $120,760 |
| 2022 | $4,099 | $113,480 | $9,600 | $103,880 |
| 2021 | $2,853 | $81,280 | $9,600 | $71,680 |
| 2020 | $2,841 | $80,080 | $9,600 | $70,480 |
| 2019 | $2,777 | $77,478 | $9,600 | $67,878 |
| 2018 | $2,572 | $72,429 | $9,600 | $62,829 |
| 2017 | $2,228 | $63,811 | $9,600 | $54,211 |
| 2016 | $2,132 | $61,454 | $9,600 | $51,854 |
| 2015 | $1,993 | $0 | $0 | $0 |
| 2014 | $1,512 | $47,034 | $9,600 | $37,434 |
Source: Public Records
Map
Nearby Homes
- 9163 Retreat Pass
- 9261 Glenleigh Way
- 9307 Glenleigh Way
- 9260 Betony Wood Trail
- 9342 Carillon Ct
- 2328 Carnes Rd
- 0 Carnes Rd Unit 7665396
- 9361 Arbor Glen Ct Unit 13
- 2330 Lago Dr
- 2345 Lake Jodeco Rd
- 9396 Fairfield Pkwy
- 9243 Seminole Rd
- 9344 Hidden Hollow Trail
- 2316 Emerald Dr
- 2444 Quentin Dr
- 2106 Fair Ridge Ct
- 2105 Fair Ridge Ct
- 2461 Creekside Trace
- 1935 Watercrest Dr
- 2519 Quentin Dr
- 2139 Hedgerow Way
- 9213 Glenleigh Way
- 9241 Glenleigh Way
- 9225 Glenleigh Way
- 2131 Hedgerow Way
- 0 Hedgerow Way Unit 3286597
- 2146 Hedgerow Way
- 2158 Hedgerow Way
- 0 Glenleigh Way Unit 7495598
- 0 Glenleigh Way Unit 8055597
- 2134 Hedgerow Way
- 2169 Hedgerow Way
- 2125 Hedgerow Way
- 2170 Glenfare Ct
- 2166 Hedgerow Way
- 2166 Hedgerow Way
- 2173 Glenfare Ct Unit XVI
- 9244 Glenleigh Way Unit XVIII
- 9236 Glenleigh Way
- 2130 Hedgerow Way