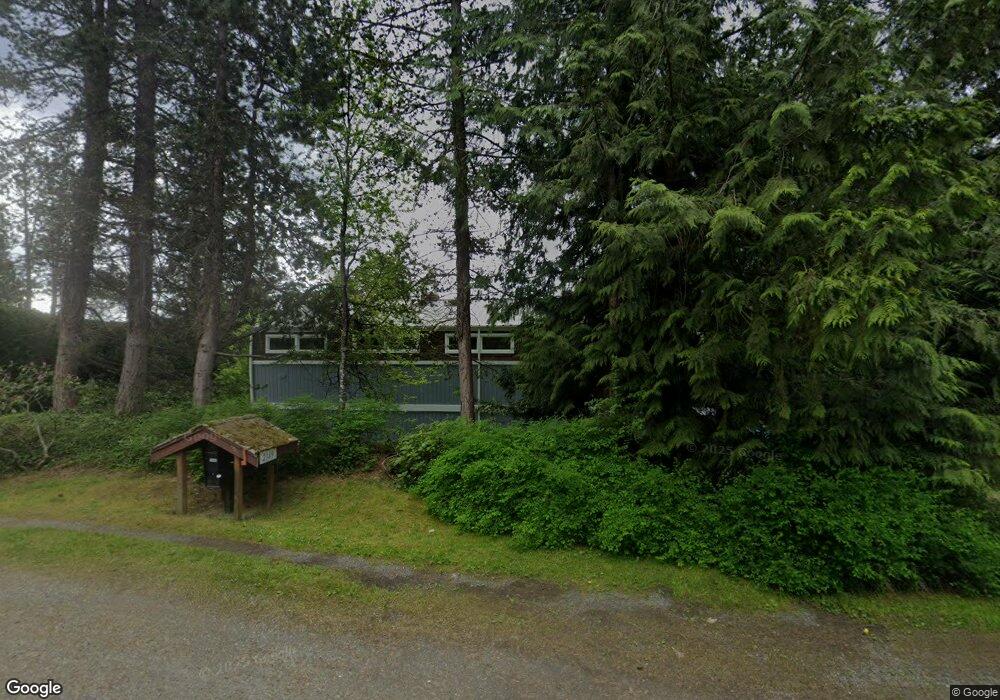
2149 N Shore Rd Bellingham, WA 98226
Estimated Value: $3,210,000 - $3,842,000
3
Beds
2
Baths
2,581
Sq Ft
$1,363/Sq Ft
Est. Value
About This Home
This home is located at 2149 N Shore Rd, Bellingham, WA 98226 and is currently estimated at $3,518,994, approximately $1,363 per square foot. 2149 N Shore Rd is a home located in Whatcom County with nearby schools including Silver Beach Elementary School, Whatcom Middle School, and Squalicum High School.
Ownership History
Date
Name
Owned For
Owner Type
Purchase Details
Closed on
Mar 7, 2018
Sold by
Burman Dennis Lee
Bought by
Marzocco Kenneth and Marzocco Lilian
Current Estimated Value
Purchase Details
Closed on
Nov 21, 2006
Sold by
Martini Steven Paul and Martini Wanda Leah
Bought by
Kaemingk James K and Kaemingk Susan
Home Financials for this Owner
Home Financials are based on the most recent Mortgage that was taken out on this home.
Original Mortgage
$1,480,000
Interest Rate
6.36%
Mortgage Type
New Conventional
Purchase Details
Closed on
May 8, 2001
Sold by
Eastham Mary Lu
Bought by
Martini Steven Paul and Martini Wanda Leah
Home Financials for this Owner
Home Financials are based on the most recent Mortgage that was taken out on this home.
Original Mortgage
$576,000
Interest Rate
6.89%
Create a Home Valuation Report for This Property
The Home Valuation Report is an in-depth analysis detailing your home's value as well as a comparison with similar homes in the area
Home Values in the Area
Average Home Value in this Area
Purchase History
| Date | Buyer | Sale Price | Title Company |
|---|---|---|---|
| Marzocco Kenneth | $1,200,000 | Whatcom Land Title | |
| Kaemingk James K | $1,850,280 | Stewart Title Company | |
| Martini Steven Paul | $618,876 | First American Title Insuran |
Source: Public Records
Mortgage History
| Date | Status | Borrower | Loan Amount |
|---|---|---|---|
| Previous Owner | Kaemingk James K | $1,480,000 | |
| Previous Owner | Martini Steven Paul | $576,000 |
Source: Public Records
Tax History Compared to Growth
Tax History
| Year | Tax Paid | Tax Assessment Tax Assessment Total Assessment is a certain percentage of the fair market value that is determined by local assessors to be the total taxable value of land and additions on the property. | Land | Improvement |
|---|---|---|---|---|
| 2024 | $24,992 | $2,828,151 | $1,498,306 | $1,329,845 |
| 2023 | $24,992 | $2,952,537 | $1,564,203 | $1,388,334 |
| 2022 | $19,880 | $2,400,437 | $1,271,710 | $1,128,727 |
| 2021 | $20,764 | $1,983,832 | $1,051,000 | $932,832 |
| 2020 | $20,204 | $1,949,645 | $986,451 | $963,194 |
| 2019 | $17,944 | $1,822,941 | $922,348 | $900,593 |
| 2018 | $18,610 | $1,636,981 | $828,448 | $808,533 |
| 2017 | $16,178 | $1,448,967 | $733,046 | $715,921 |
| 2016 | $14,795 | $1,314,449 | $664,812 | $649,637 |
| 2015 | $15,226 | $1,239,734 | $626,000 | $613,734 |
| 2014 | -- | $1,240,712 | $657,300 | $583,412 |
| 2013 | -- | $1,174,672 | $626,000 | $548,672 |
Source: Public Records
Map
Nearby Homes
- 2141 Northshore Rd
- 2678 Strawberry Shore Dr
- 3187 Agate Bay Ln
- 2593 Northshore Rd
- 1538 Fairview St
- 2516 Northshore Rd Unit 15
- 4926 Columbus Ave
- 1558 Fairview St
- 2959 Lake Whatcom Blvd
- 1555 Fairview St
- 911 Coronado Ave
- 4926 Coronado Ln
- 1715 Eagleridge Dr
- 4640 Cable St
- 3108 NHN Northshore Rd
- 4541 Cable St
- 3401 E 17th Crest
- 4750 Lost Creek Ln
- 2550 Lake Whatcom Blvd
- 1402 Langara Cir
- 2157 Northshore Rd
- 2149 Northshore Rd
- 2165 Northshore Rd
- 2141 Northshore Rd
- 2133 N Shore Rd
- 2173 N Shore Rd
- 2125 N Shore Rd
- 2181 N Shore Rd
- 2189 Northshore Rd
- 2109 N Shore Rd
- 2189 N Shore Rd
- 2154 Northshore Rd
- 2117 Northshore Rd
- 2195 Northshore Rd
- 2101 N Shore Rd
- 2197 Northshore Rd
- 2197 Northshore Rd
- 2105 Northshore Rd
- 2095 Northshore Rd