Estimated Value: $733,000 - $861,000
3
Beds
3
Baths
2,760
Sq Ft
$286/Sq Ft
Est. Value
About This Home
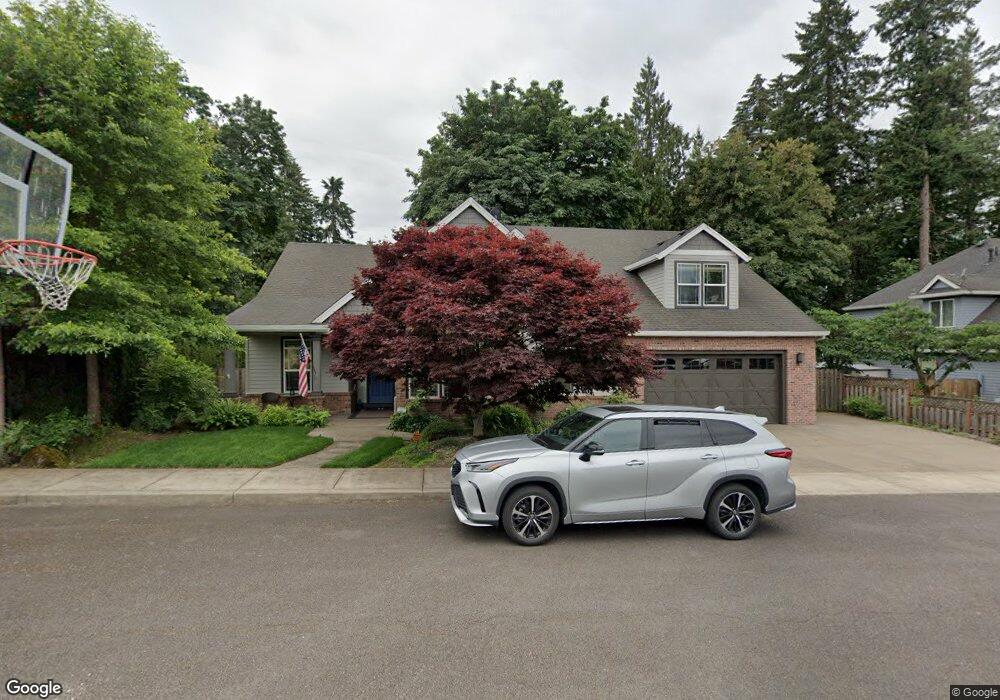
This home is located at 2149 NE 20th Ave, Canby, OR 97013 and is currently estimated at $789,815, approximately $286 per square foot. 2149 NE 20th Ave is a home located in Clackamas County with nearby schools including Josefa L. Sambrano Elementary School, William Knight Elementary School, and Baker Prairie Middle School.
Ownership History
Date
Name
Owned For
Owner Type
Purchase Details
Closed on
Feb 1, 2024
Sold by
Rawls Lisa A
Bought by
Rawls Alton E
Current Estimated Value
Purchase Details
Closed on
Nov 8, 2006
Sold by
Nick Netter Construction Inc
Bought by
Potter Gary A and Potter Lisa A
Home Financials for this Owner
Home Financials are based on the most recent Mortgage that was taken out on this home.
Original Mortgage
$310,400
Interest Rate
6.3%
Mortgage Type
Purchase Money Mortgage
Purchase Details
Closed on
Jan 13, 2005
Sold by
Netter Nick and Netter Jamie
Bought by
Nick Netter Construction Inc
Home Financials for this Owner
Home Financials are based on the most recent Mortgage that was taken out on this home.
Original Mortgage
$75,000
Interest Rate
6.75%
Mortgage Type
Purchase Money Mortgage
Create a Home Valuation Report for This Property
The Home Valuation Report is an in-depth analysis detailing your home's value as well as a comparison with similar homes in the area
Home Values in the Area
Average Home Value in this Area
Purchase History
| Date | Buyer | Sale Price | Title Company |
|---|---|---|---|
| Rawls Alton E | -- | None Listed On Document | |
| Potter Gary A | $499,400 | Chicago Title Co | |
| Nick Netter Construction Inc | $75,000 | Chicago Title Insurance Comp |
Source: Public Records
Mortgage History
| Date | Status | Borrower | Loan Amount |
|---|---|---|---|
| Previous Owner | Potter Gary A | $310,400 | |
| Previous Owner | Nick Netter Construction Inc | $75,000 |
Source: Public Records
Tax History Compared to Growth
Tax History
| Year | Tax Paid | Tax Assessment Tax Assessment Total Assessment is a certain percentage of the fair market value that is determined by local assessors to be the total taxable value of land and additions on the property. | Land | Improvement |
|---|---|---|---|---|
| 2025 | $7,365 | $415,700 | -- | -- |
| 2024 | $7,158 | $403,593 | -- | -- |
| 2023 | $7,158 | $391,838 | $0 | $0 |
| 2022 | $6,584 | $380,426 | $0 | $0 |
| 2021 | $6,340 | $369,346 | $0 | $0 |
| 2020 | $6,227 | $358,589 | $0 | $0 |
| 2019 | $5,930 | $348,145 | $0 | $0 |
| 2018 | $5,797 | $338,005 | $0 | $0 |
| 2017 | $5,650 | $328,160 | $0 | $0 |
| 2016 | $5,462 | $318,602 | $0 | $0 |
| 2015 | $5,274 | $309,322 | $0 | $0 |
| 2014 | $5,123 | $300,313 | $0 | $0 |
Source: Public Records
Map
Nearby Homes
- 2125 NE Spitz Rd
- 2123 NE Spitz Rd
- 1947 NE 21st Ave
- 1620 N Sweetgum St
- 1552 NE 19th Loop
- 1422 NE 18th Place
- 32088 SW Peach Cove Rd
- 1200 NE Territorial Rd Unit 93
- 1558 NE 10th Place
- 1009 NE 17th Ave
- 1750 N Oak St
- 878 NE 17th Ave
- 952 NE 17th Ave
- 947 NE 17th Ave
- 844 NE 17th Ave
- 838 NE 17th Ave
- 853 NE 17th Ave
- 832 NE 17th Ave
- 31616 SW Isle Way Ln
- 860 NE 14th Ave
- 2127 NE 20th Ave
- 2142 NE 20th Ave
- 2120 NE 20th Ave
- 1995 N Walnut St
- 2015 N Walnut St
- 2096 N Walnut St
- 2045 N Walnut St
- 2045 N Walnut St
- 2084 N Walnut St
- 2095 N Walnut St
- 2060 NE 19th Ave
- 2042 N Vine St
- 2110 N Walnut St
- 2285 NE Territorial Rd
- 2090 N Vine St
- 2063 NE 19th Ave
- 2265 NE Territorial Rd
- 2101 N Walnut St
- 2030 N Vine St
- 2066 N Vine St