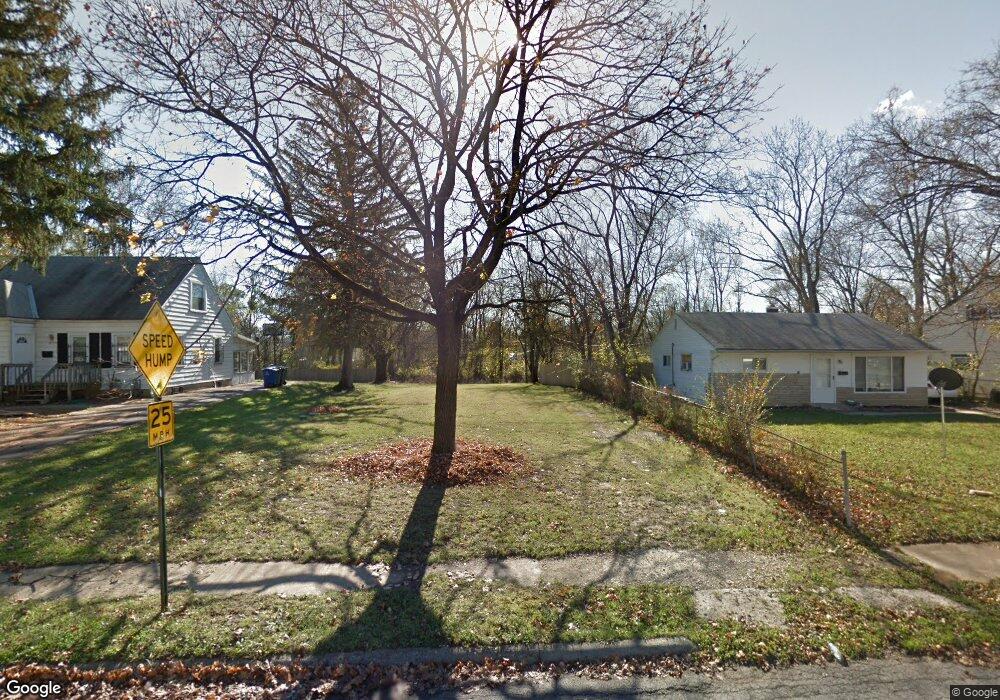
2149 Sagamore Rd Columbus, OH 43219
Woodland Holt NeighborhoodEstimated Value: $157,889
3
Beds
1
Bath
1,442
Sq Ft
$109/Sq Ft
Est. Value
About This Home
This home is located at 2149 Sagamore Rd, Columbus, OH 43219 and is currently estimated at $157,889, approximately $109 per square foot. 2149 Sagamore Rd is a home located in Franklin County with nearby schools including South Mifflin Stem Academy (K-6), Linden-Mckinley Stem School On Arcadia, and Cesar Chavez College Preparatory School.
Ownership History
Date
Name
Owned For
Owner Type
Purchase Details
Closed on
Feb 20, 2015
Sold by
Carr Shannon and Leonard Edward
Bought by
City Of Columbus
Current Estimated Value
Purchase Details
Closed on
May 2, 2003
Sold by
M & K Homes Llc
Bought by
Carr Shannon
Home Financials for this Owner
Home Financials are based on the most recent Mortgage that was taken out on this home.
Original Mortgage
$61,750
Interest Rate
9.12%
Purchase Details
Closed on
Feb 10, 2003
Sold by
Chase Manhattan Bank
Bought by
M & K Homes Llc
Home Financials for this Owner
Home Financials are based on the most recent Mortgage that was taken out on this home.
Original Mortgage
$40,000
Interest Rate
6%
Purchase Details
Closed on
Nov 4, 2002
Sold by
Lowe Jonathan and Case #98Cve12 9458
Bought by
Chase Manhattan Bank and Security National Mtg Loan Trust 2001-2
Purchase Details
Closed on
Aug 28, 1978
Bought by
Lowe Jonathan
Create a Home Valuation Report for This Property
The Home Valuation Report is an in-depth analysis detailing your home's value as well as a comparison with similar homes in the area
Home Values in the Area
Average Home Value in this Area
Purchase History
| Date | Buyer | Sale Price | Title Company |
|---|---|---|---|
| City Of Columbus | -- | None Available | |
| Carr Shannon | $65,000 | Esquire Title | |
| M & K Homes Llc | $22,000 | Esquire Title | |
| Chase Manhattan Bank | $65,395 | -- | |
| Lowe Jonathan | -- | -- |
Source: Public Records
Mortgage History
| Date | Status | Borrower | Loan Amount |
|---|---|---|---|
| Previous Owner | Carr Shannon | $61,750 | |
| Previous Owner | M & K Homes Llc | $40,000 |
Source: Public Records
Tax History Compared to Growth
Tax History
| Year | Tax Paid | Tax Assessment Tax Assessment Total Assessment is a certain percentage of the fair market value that is determined by local assessors to be the total taxable value of land and additions on the property. | Land | Improvement |
|---|---|---|---|---|
| 2024 | -- | $9,030 | $9,030 | -- |
| 2023 | -- | $9,030 | $9,030 | $0 |
| 2022 | $0 | $1,400 | $1,400 | $0 |
| 2021 | $0 | $1,400 | $1,400 | $0 |
| 2020 | $0 | $1,400 | $1,400 | $0 |
| 2019 | $0 | $1,120 | $1,120 | $0 |
| 2018 | $0 | $1,120 | $1,120 | $0 |
| 2017 | $0 | $1,120 | $1,120 | $0 |
| 2016 | $0 | $1,120 | $1,120 | $0 |
| 2015 | -- | $1,120 | $1,120 | $0 |
| 2014 | $960 | $15,480 | $3,050 | $12,430 |
| 2013 | $857 | $17,185 | $3,395 | $13,790 |
Source: Public Records
Map
Nearby Homes
- 2054 Jermain Dr
- 1991 Woodland Ave
- 0 Rankin Ave Unit (Rear)
- 1789 Marston Rd
- 1975 Mock Rd
- 0 Danby Dr
- 1882 Dunning Rd
- 1790 Marston Rd
- 2336 Edenburgh Dr S
- 1808 Brentnell Ave
- 0 Mock Rd
- 1794 Devonshire Rd
- 0 Parkwood Ave
- 1978 Argyle Dr
- 2040 Loretta Ave
- 2471 Mock Rd
- 2398 Dunkirk Dr
- 1864 E Hudson St
- 0 Delbert Rd Unit 225030362
- 1810 E 26th Ave
- 2155 Sagamore Rd
- 2147 Sagamore Rd
- 2161 Sagamore Rd
- 2133 Sagamore Rd
- 2169 Sagamore Rd
- 2127 Sagamore Rd
- 2150 Sagamore Rd
- 2140 Sagamore Rd
- 2168 Delavan Dr
- 2175 Sagamore Rd
- 2119 Sagamore Rd
- 2172 Delavan Dr
- 2181 Sagamore Rd
- 2026 Jermain Dr
- 2176 Delavan Dr
- 2111 Sagamore Rd
- 2122 Sagamore Rd
- 2126 Middlehurst Dr
- 2138 Middlehurst Dr
- 2120 Middlehurst Dr