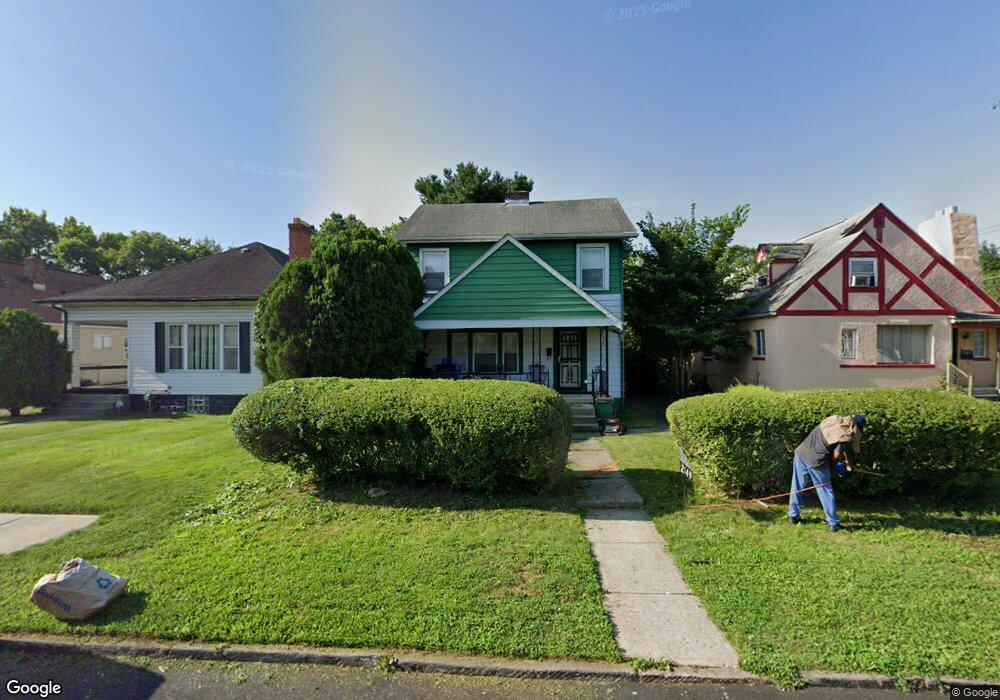
2149 Willamont Ave Columbus, OH 43219
Shepard NeighborhoodEstimated Value: $165,000 - $284,000
3
Beds
1
Bath
1,632
Sq Ft
$140/Sq Ft
Est. Value
About This Home
This home is located at 2149 Willamont Ave, Columbus, OH 43219 and is currently estimated at $228,223, approximately $139 per square foot. 2149 Willamont Ave is a home located in Franklin County with nearby schools including East Columbus Elementary School, Champion Middle School, and East High School.
Ownership History
Date
Name
Owned For
Owner Type
Purchase Details
Closed on
Apr 25, 2006
Sold by
Goolsby Brack
Bought by
Robinson Jerry D and Robinson Jerry D
Current Estimated Value
Purchase Details
Closed on
Apr 24, 2006
Sold by
Couch Alfred and Couch Leona
Bought by
Robinson Jerry D and Robinson Jerry D
Purchase Details
Closed on
May 8, 1992
Bought by
Goolsby Brack
Purchase Details
Closed on
Mar 23, 1992
Purchase Details
Closed on
Mar 12, 1992
Create a Home Valuation Report for This Property
The Home Valuation Report is an in-depth analysis detailing your home's value as well as a comparison with similar homes in the area
Home Values in the Area
Average Home Value in this Area
Purchase History
| Date | Buyer | Sale Price | Title Company |
|---|---|---|---|
| Robinson Jerry D | $57,900 | None Available | |
| Robinson Jerry D | -- | None Available | |
| Goolsby Brack | $29,000 | -- | |
| -- | -- | -- | |
| -- | -- | -- |
Source: Public Records
Tax History
| Year | Tax Paid | Tax Assessment Tax Assessment Total Assessment is a certain percentage of the fair market value that is determined by local assessors to be the total taxable value of land and additions on the property. | Land | Improvement |
|---|---|---|---|---|
| 2025 | $3,360 | $70,040 | $7,420 | $62,620 |
| 2024 | $3,360 | $70,040 | $7,420 | $62,620 |
| 2023 | $3,402 | $70,035 | $7,420 | $62,615 |
| 2022 | $1,424 | $23,980 | $2,800 | $21,180 |
| 2021 | $1,509 | $23,980 | $2,800 | $21,180 |
| 2020 | $1,429 | $23,980 | $2,800 | $21,180 |
| 2019 | $1,445 | $20,830 | $2,450 | $18,380 |
| 2018 | $1,235 | $20,830 | $2,450 | $18,380 |
| 2017 | $1,345 | $20,830 | $2,450 | $18,380 |
| 2016 | $1,123 | $15,790 | $2,840 | $12,950 |
| 2015 | $1,027 | $15,790 | $2,840 | $12,950 |
| 2014 | $979 | $15,790 | $2,840 | $12,950 |
| 2013 | $586 | $17,535 | $3,150 | $14,385 |
Source: Public Records
Map
Nearby Homes
- 2102-2104 Avalon Place
- 837 Sunbury Rd
- 2250 Willamont Ave
- 2262 Willamont Ave
- 670 Cumberland St
- 854 Brentnell Ave
- 649 N Nelson Rd Unit A-D
- 2278 Ridgeway Ave Unit 278
- 984 Sunbury Rd
- 484 N Parkview Ave
- 1089 Wellington Blvd
- 1994 Stratford Way
- 1740 Old Leonard Ave
- 2288 Woodward Ave
- 2570 E 5th Ave
- 291 Sherborne Dr
- 696 Northview Ave
- 629 N Dawson Ave
- 0 Taylor Ave Unit 225029840
- 821 Taylor Ave Unit 23
- 2143 Willamont Ave
- 2155 Willamont Ave
- 2159 Willamont Ave
- 2165 Willamont Ave
- 2133 Willamont Ave
- 2171 Willamont Ave
- 2127 Willamont Ave
- 2140 Dartmouth Ave
- 2146 Dartmouth Ave
- 2150 Dartmouth Ave
- 2152 Willamont Ave
- 2146 Willamont Ave
- 2158 Willamont Ave
- 2121 Willamont Ave
- 2175 Willamont Ave
- 2162 Willamont Ave
- 2156 Dartmouth Ave
- 2124 Dartmouth Ave
- 2168 Willamont Ave
- 2136 Willamont Ave
Your Personal Tour Guide
Ask me questions while you tour the home.