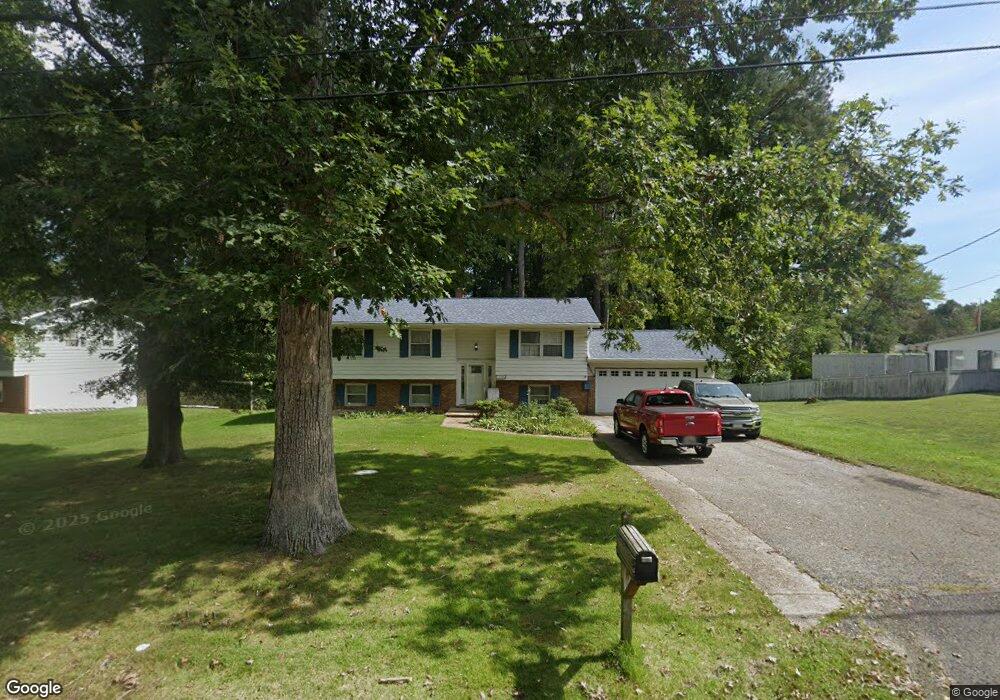
21496 Lynn Dr Lexington Park, MD 20653
Estimated Value: $270,790 - $332,000
--
Bed
3
Baths
1,122
Sq Ft
$274/Sq Ft
Est. Value
About This Home
This home is located at 21496 Lynn Dr, Lexington Park, MD 20653 and is currently estimated at $306,948, approximately $273 per square foot. 21496 Lynn Dr is a home located in St. Mary's County with nearby schools including Lexington Park Elementary School, Spring Ridge Middle School, and Great Mills High School.
Ownership History
Date
Name
Owned For
Owner Type
Purchase Details
Closed on
Jun 15, 1990
Sold by
Potter David L
Bought by
Lavalle Jacque David and Lavalle Christine A
Current Estimated Value
Home Financials for this Owner
Home Financials are based on the most recent Mortgage that was taken out on this home.
Original Mortgage
$120,350
Interest Rate
10.12%
Purchase Details
Closed on
Oct 29, 1985
Sold by
Hamburg Gerald
Bought by
Potter David L
Home Financials for this Owner
Home Financials are based on the most recent Mortgage that was taken out on this home.
Original Mortgage
$91,000
Interest Rate
12.07%
Purchase Details
Closed on
Oct 8, 1985
Sold by
Moyer Merlin F and Moyer Mary
Bought by
Hamburg Gerald
Home Financials for this Owner
Home Financials are based on the most recent Mortgage that was taken out on this home.
Original Mortgage
$91,000
Interest Rate
12.07%
Create a Home Valuation Report for This Property
The Home Valuation Report is an in-depth analysis detailing your home's value as well as a comparison with similar homes in the area
Home Values in the Area
Average Home Value in this Area
Purchase History
| Date | Buyer | Sale Price | Title Company |
|---|---|---|---|
| Lavalle Jacque David | $118,900 | -- | |
| Potter David L | $91,000 | -- | |
| Hamburg Gerald | $91,100 | -- |
Source: Public Records
Mortgage History
| Date | Status | Borrower | Loan Amount |
|---|---|---|---|
| Closed | Lavalle Jacque David | $120,350 | |
| Previous Owner | Potter David L | $91,000 | |
| Previous Owner | Hamburg Gerald | $30,100 |
Source: Public Records
Tax History Compared to Growth
Tax History
| Year | Tax Paid | Tax Assessment Tax Assessment Total Assessment is a certain percentage of the fair market value that is determined by local assessors to be the total taxable value of land and additions on the property. | Land | Improvement |
|---|---|---|---|---|
| 2025 | $2,419 | $242,667 | $0 | $0 |
| 2024 | $2,336 | $223,233 | $0 | $0 |
| 2023 | $2,254 | $203,800 | $94,000 | $109,800 |
| 2022 | $2,194 | $198,333 | $0 | $0 |
| 2021 | $2,135 | $192,867 | $0 | $0 |
| 2020 | $2,075 | $187,400 | $84,000 | $103,400 |
| 2019 | $2,073 | $187,400 | $84,000 | $103,400 |
| 2018 | $2,071 | $187,400 | $84,000 | $103,400 |
| 2017 | $2,202 | $202,700 | $0 | $0 |
| 2016 | -- | $202,700 | $0 | $0 |
| 2015 | $1,939 | $202,700 | $0 | $0 |
| 2014 | $1,939 | $205,100 | $0 | $0 |
Source: Public Records
Map
Nearby Homes
- 21491 Lynn Dr
- 46701 Thomas Dr
- 46842 Patuxent Rd
- 21470 Colleen Place
- 21301 Scarborough Dr
- 21660 N Essex Dr
- 21683 Hancock Rd
- 46714 Sandalwood St
- 21744 Louden Ln
- 46689 Sandalwood St
- 21488 Forest Run Dr
- 46281 Mako Way
- 0 Three Notch Rd
- 46444 Munley Ln
- 46442 Munley Ln
- Parcel 331 & 332 Willows Rd
- 20968 Rowan Knight Dr
- 47209 Lincoln Ave
- 20992 Freedom Run Dr
- 0 Willows Rd Unit MDSM2022800
- 21510 Lynn Dr
- 21486 Lynn Dr
- 21503 Lynn Dr
- 21518 Lynn Dr
- 21481 Lynn Dr
- 21513 Lynn Dr
- 21468 Lynn Dr
- 21522 Lynn Dr
- 21475 Williams Dr
- 21525 Lynn Dr
- 21498 S Essex Dr
- 21502 S Essex Dr
- 46760 Thomas Dr
- 46686 Thomas Dr
- 21518 S Essex Dr
- 21474 Williams Dr
- 21455 Williams Dr
- 21529 Lynn Dr
- 21526 S Essex Dr
- 21457 Lynn Dr