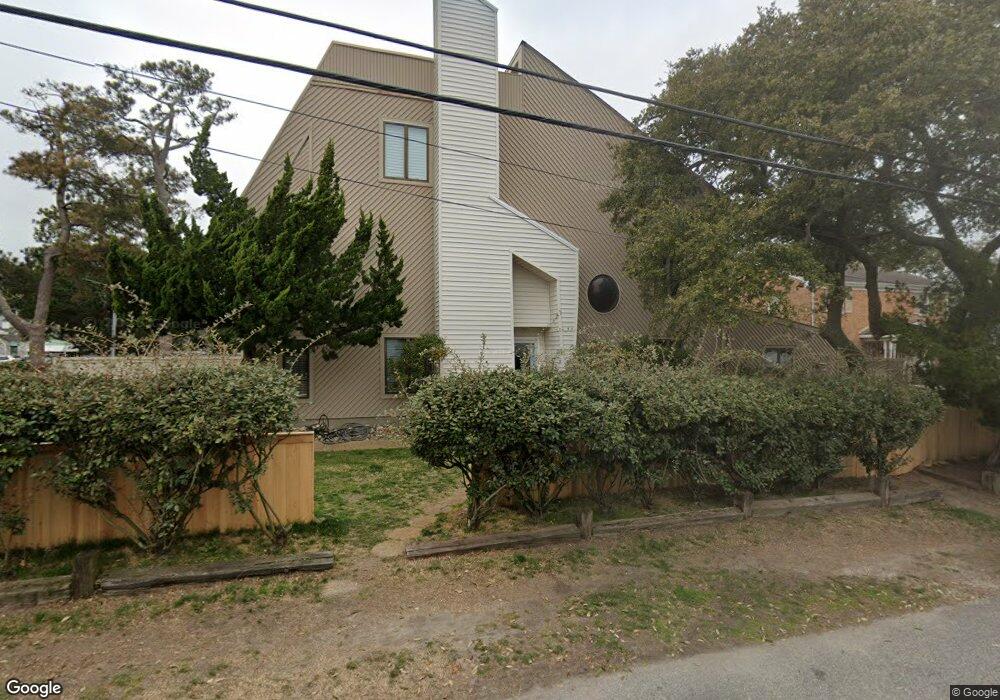
215 76th St Unit A Virginia Beach, VA 23451
North End NeighborhoodEstimated Value: $786,000 - $1,075,000
3
Beds
3
Baths
2,200
Sq Ft
$414/Sq Ft
Est. Value
About This Home
This home is located at 215 76th St Unit A, Virginia Beach, VA 23451 and is currently estimated at $910,929, approximately $414 per square foot. 215 76th St Unit A is a home located in Virginia Beach City with nearby schools including Linkhorn Park Elementary School, Virginia Beach Middle School, and Frank W. Cox High School.
Ownership History
Date
Name
Owned For
Owner Type
Purchase Details
Closed on
May 20, 2022
Sold by
Scott Thornhill L and Scott Anne M
Bought by
Working Sergei and Working Anastasia
Current Estimated Value
Home Financials for this Owner
Home Financials are based on the most recent Mortgage that was taken out on this home.
Original Mortgage
$400,000
Outstanding Balance
$379,127
Interest Rate
5%
Mortgage Type
New Conventional
Estimated Equity
$531,802
Purchase Details
Closed on
May 23, 2011
Sold by
Nelson Tr Philip B and Philip B Nelson Trust
Bought by
Nelson Tr Kathryn A and Philip B Nelson Trust
Home Financials for this Owner
Home Financials are based on the most recent Mortgage that was taken out on this home.
Original Mortgage
$380,000
Interest Rate
4.81%
Mortgage Type
New Conventional
Purchase Details
Closed on
Sep 27, 2001
Sold by
Damanpour Faramarz
Bought by
Nelson Philip B
Home Financials for this Owner
Home Financials are based on the most recent Mortgage that was taken out on this home.
Original Mortgage
$140,000
Interest Rate
6.86%
Create a Home Valuation Report for This Property
The Home Valuation Report is an in-depth analysis detailing your home's value as well as a comparison with similar homes in the area
Home Values in the Area
Average Home Value in this Area
Purchase History
| Date | Buyer | Sale Price | Title Company |
|---|---|---|---|
| Working Sergei | $735,000 | None Listed On Document | |
| Nelson Tr Kathryn A | $590,000 | -- | |
| Nelson Philip B | $297,000 | -- |
Source: Public Records
Mortgage History
| Date | Status | Borrower | Loan Amount |
|---|---|---|---|
| Open | Working Sergei | $400,000 | |
| Previous Owner | Nelson Tr Kathryn A | $380,000 | |
| Previous Owner | Nelson Philip B | $140,000 |
Source: Public Records
Tax History
| Year | Tax Paid | Tax Assessment Tax Assessment Total Assessment is a certain percentage of the fair market value that is determined by local assessors to be the total taxable value of land and additions on the property. | Land | Improvement |
|---|---|---|---|---|
| 2025 | $7,550 | $888,800 | $550,000 | $338,800 |
| 2024 | $7,550 | $778,300 | $500,000 | $278,300 |
Source: Public Records
Map
Nearby Homes
- 7606 Atlantic Ave
- 219 77th St Unit B
- 7709 Atlantic Ave Unit B
- 110 75th St
- 116 72nd St Unit X0884
- 114 70th St Unit B
- 114 70th St Unit A
- 106 70th St Unit B
- 211 69th St
- 6904 Ocean Front Ave
- 8408 Ocean Front Ave Unit A
- 8502 Ocean Front Ave Unit A
- 125 67th St
- 6604 Atlantic Ave
- 211 86th St Unit F
- 8700 Ocean Front Ave
- 6502 Atlantic Ave
- 205 65th St
- 8704 Ocean Front Ave Unit A
- 218 88th St Unit A
Your Personal Tour Guide
Ask me questions while you tour the home.