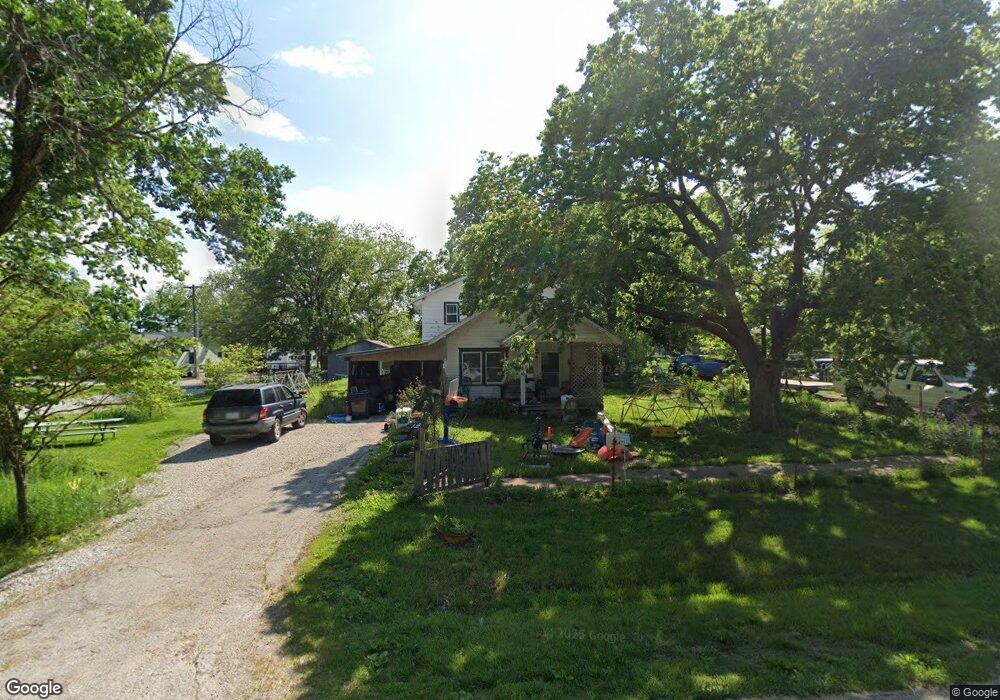
215 Atherly St Gridley, KS 66852
Estimated Value: $62,142 - $248,000
4
Beds
2
Baths
2,672
Sq Ft
$50/Sq Ft
Est. Value
About This Home
This home is located at 215 Atherly St, Gridley, KS 66852 and is currently estimated at $133,286, approximately $49 per square foot. 215 Atherly St is a home located in Coffey County with nearby schools including Southern Coffey County Elementary School, Southern Coffey County Junior High School, and Southern Coffey County High School.
Create a Home Valuation Report for This Property
The Home Valuation Report is an in-depth analysis detailing your home's value as well as a comparison with similar homes in the area
Purchase History
| Date | Buyer | Sale Price | Title Company |
|---|---|---|---|
| Dyke Thomas D | -- | -- |
Source: Public Records
Tax History
| Year | Tax Paid | Tax Assessment Tax Assessment Total Assessment is a certain percentage of the fair market value that is determined by local assessors to be the total taxable value of land and additions on the property. | Land | Improvement |
|---|---|---|---|---|
| 2025 | $283 | $2,254 | $284 | $1,970 |
| 2024 | $2 | $1,878 | $284 | $1,594 |
| 2023 | $207 | $1,633 | $284 | $1,349 |
| 2022 | $179 | $1,555 | $284 | $1,271 |
| 2020 | $179 | $1,393 | $284 | $1,109 |
| 2019 | $196 | $1,569 | $284 | $1,285 |
| 2018 | $185 | $1,500 | $284 | $1,216 |
| 2017 | $185 | $1,501 | $284 | $1,217 |
| 2016 | $190 | $1,511 | $284 | $1,227 |
| 2015 | -- | $1,249 | $284 | $965 |
| 2014 | -- | $1,249 | $284 | $965 |
Source: Public Records
Map
Nearby Homes
Your Personal Tour Guide
Ask me questions while you tour the home.