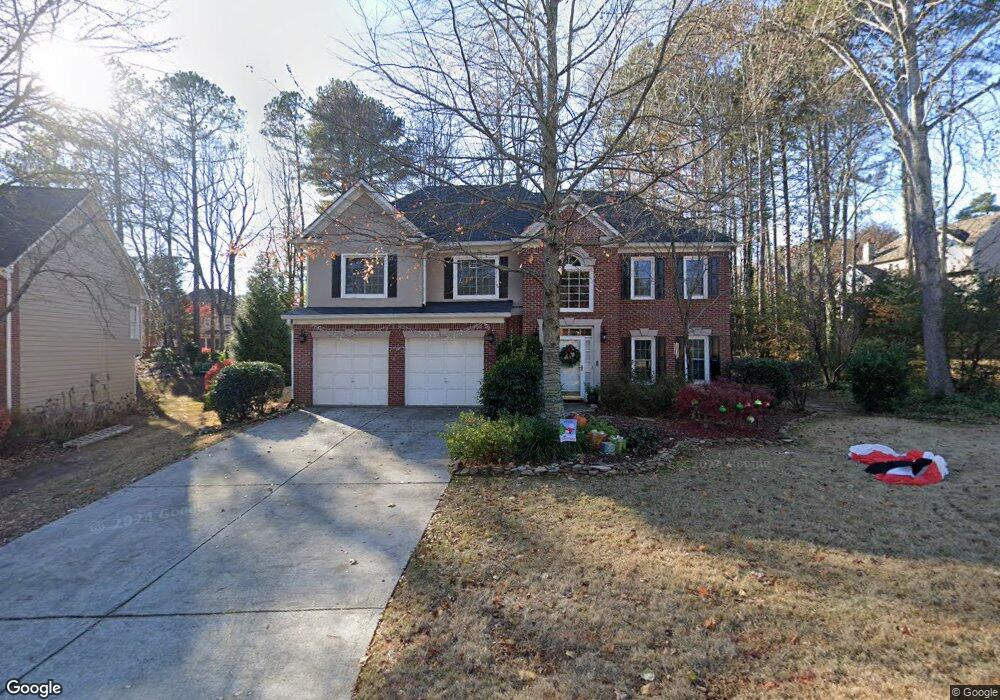
215 Bristolstone Ct Unit 5 Alpharetta, GA 30005
Estimated Value: $642,000 - $707,000
4
Beds
3
Baths
2,492
Sq Ft
$271/Sq Ft
Est. Value
About This Home
This home is located at 215 Bristolstone Ct Unit 5, Alpharetta, GA 30005 and is currently estimated at $674,277, approximately $270 per square foot. 215 Bristolstone Ct Unit 5 is a home located in Fulton County with nearby schools including Abbotts Hill Elementary School, Taylor Road Middle School, and Chattahoochee High School.
Ownership History
Date
Name
Owned For
Owner Type
Purchase Details
Closed on
May 20, 2011
Sold by
Reid Christine A
Bought by
Osmerg Lars and Osmerg Jill K
Current Estimated Value
Home Financials for this Owner
Home Financials are based on the most recent Mortgage that was taken out on this home.
Original Mortgage
$219,450
Outstanding Balance
$151,308
Interest Rate
4.71%
Mortgage Type
New Conventional
Estimated Equity
$522,969
Purchase Details
Closed on
Dec 6, 2000
Sold by
Montag Ruth A
Bought by
Reid Christine A
Home Financials for this Owner
Home Financials are based on the most recent Mortgage that was taken out on this home.
Original Mortgage
$168,000
Interest Rate
7.71%
Mortgage Type
New Conventional
Purchase Details
Closed on
Feb 27, 1995
Sold by
Chier Terrence M
Bought by
Montag Ruth A
Create a Home Valuation Report for This Property
The Home Valuation Report is an in-depth analysis detailing your home's value as well as a comparison with similar homes in the area
Home Values in the Area
Average Home Value in this Area
Purchase History
| Date | Buyer | Sale Price | Title Company |
|---|---|---|---|
| Osmerg Lars | $231,000 | -- | |
| Reid Christine A | $210,000 | -- | |
| Montag Ruth A | $171,500 | -- |
Source: Public Records
Mortgage History
| Date | Status | Borrower | Loan Amount |
|---|---|---|---|
| Open | Osmerg Lars | $219,450 | |
| Previous Owner | Reid Christine A | $168,000 | |
| Closed | Montag Ruth A | $0 |
Source: Public Records
Tax History Compared to Growth
Tax History
| Year | Tax Paid | Tax Assessment Tax Assessment Total Assessment is a certain percentage of the fair market value that is determined by local assessors to be the total taxable value of land and additions on the property. | Land | Improvement |
|---|---|---|---|---|
| 2025 | $3,779 | $253,240 | $62,760 | $190,480 |
| 2023 | $6,053 | $214,440 | $48,800 | $165,640 |
| 2022 | $3,611 | $181,720 | $45,080 | $136,640 |
| 2021 | $3,562 | $140,720 | $39,320 | $101,400 |
| 2020 | $3,581 | $132,400 | $32,040 | $100,360 |
| 2019 | $430 | $130,080 | $31,480 | $98,600 |
| 2018 | $3,630 | $127,000 | $30,720 | $96,280 |
| 2017 | $3,533 | $116,760 | $32,640 | $84,120 |
| 2016 | $3,432 | $116,760 | $32,640 | $84,120 |
| 2015 | $3,412 | $114,320 | $32,640 | $81,680 |
| 2014 | $2,799 | $92,400 | $26,360 | $66,040 |
Source: Public Records
Map
Nearby Homes
- 11575 Windbrooke Way Unit 2
- 11615 Windbrooke Way
- 5610 N Hillbrooke Trace
- 5575 Ashwind Trace
- 775 Ellsborough Ct
- 5470 N Hillbrooke Trace
- 130 Wyndlam Ct
- 5325 Hillgate Crossing
- 11420 Crossington Rd
- 5785 Oxborough Way Unit 1
- 335 Dunhill Way Ct
- 11260 Donnington Dr
- 640 Arncliffe Ct Unit 1
- 230 Sessingham Ln
- 5160 Abbotts Bridge Rd
- 5680 Abbotts Bridge Rd
- 225 Bristolstone Ct Unit 5
- 5635 N Hillbrooke Trace
- 320 Bristle Stone Ln Unit 4
- 5625 N Hillbrooke Trace
- 310 Bristle Stone Ln
- 235 Bristolstone Ct
- 330 Bristol Stone Ln Unit 4
- 5615 N Hillbrooke Trace
- 5655 N Hillbrooke Trace Unit 5
- 210 Bristolstone Ct Unit 5
- 5605 N Hillbrooke Trace Unit 4
- 340 Bristle Stone Ln
- 340 Bristol Stone Ln
- 245 Bristolstone Ct Unit 5
- 220 Bristolstone Ct
- 5660 N Hillbrooke Trace
- 0 Bristol Stone Ln Unit 7336238
- 0 Bristol Stone Ln Unit 8488058
- 0 Bristol Stone Ln Unit 8125916
- 0 Bristol Stone Ln