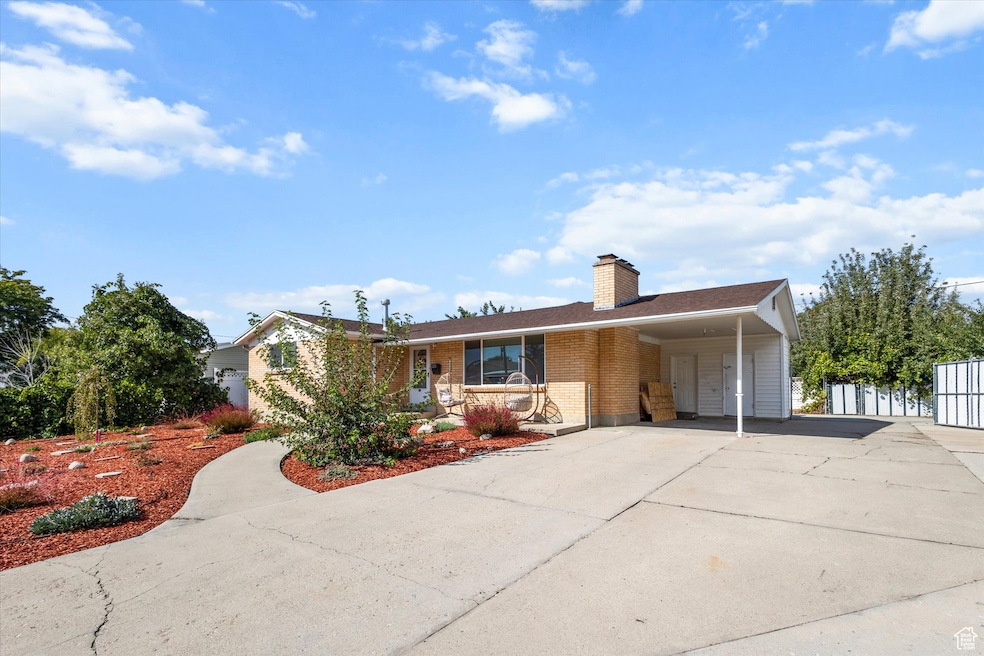


215 Carol Way Midvale, UT 84047
Estimated payment $3,295/month
Highlights
- RV or Boat Parking
- Updated Kitchen
- Mountain View
- Hillcrest High School Rated A-
- Mature Trees
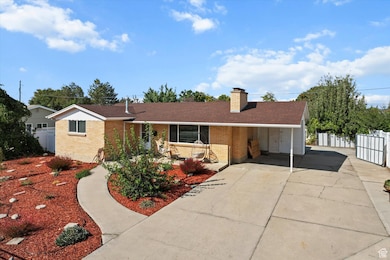
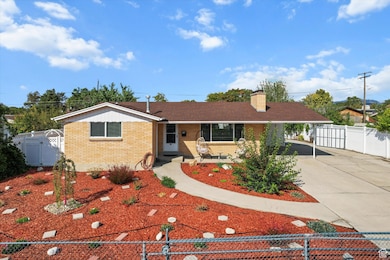
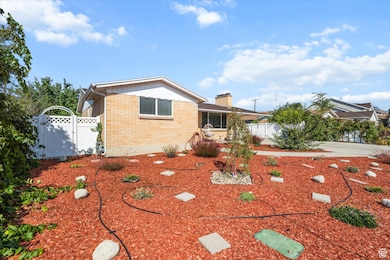
- Rambler Architecture
About This Home
This beautifully updated Midvale home has everything you need-5 bedrooms including a spacious master with fireplace. Enjoy a brand-new kitchen, fresh paint, new LVP flooring, and carpet throughout. South-facing lot with a long RV pad, fully fenced front yard, and low-maintenance landscaping. Home features updated vinyl windows, a reverse osmosis system, and all appliances included. Newer architectural shingled roof (3 years old) adds peace of mind. A perfect family home in a convenient location! Minutes from I-15 & Fashion Place Mall.
Home Details
Home Type
- Single Family
Est. Annual Taxes
- $3,110
Year Built
- Built in 1965
Lot Details
- 8,712 Sq Ft Lot
- Property is Fully Fenced
- Xeriscape Landscape
- Mature Trees
- Vegetable Garden
- Property is zoned Single-Family
Home Design
- Rambler Architecture
- Brick Exterior Construction
Interior Spaces
- 2,442 Sq Ft Home
- 2-Story Property
- Ceiling Fan
- 2 Fireplaces
- Double Pane Windows
- Blinds
- Green House Windows
- Carpet
- Mountain Views
- Basement Fills Entire Space Under The House
- Storm Doors
Kitchen
- Updated Kitchen
- Free-Standing Range
- Microwave
- Disposal
Bedrooms and Bathrooms
- 5 Bedrooms | 2 Main Level Bedrooms
- 2 Full Bathrooms
Laundry
- Dryer
- Washer
Parking
- 5 Parking Spaces
- 1 Carport Space
- 4 Open Parking Spaces
- RV or Boat Parking
Eco-Friendly Details
- Drip Irrigation
Outdoor Features
- Open Patio
- Storage Shed
- Outbuilding
- Outdoor Gas Grill
Schools
- East Midvale Elementary School
- Midvale Middle School
- Hillcrest High School
Utilities
- Forced Air Heating and Cooling System
- Natural Gas Connected
Community Details
- No Home Owners Association
- Ramanee Subdivision
Listing and Financial Details
- Home warranty included in the sale of the property
- Assessor Parcel Number 22-30-180-038
Map
Home Values in the Area
Average Home Value in this Area
Tax History
| Year | Tax Paid | Tax Assessment Tax Assessment Total Assessment is a certain percentage of the fair market value that is determined by local assessors to be the total taxable value of land and additions on the property. | Land | Improvement |
|---|---|---|---|---|
| 2025 | $2,850 | $493,900 | $157,600 | $336,300 |
| 2024 | $2,850 | $467,900 | $147,900 | $320,000 |
| 2023 | $2,477 | $402,900 | $140,700 | $262,200 |
| 2022 | $2,615 | $415,500 | $137,900 | $277,600 |
| 2021 | $2,331 | $316,700 | $137,900 | $178,800 |
| 2020 | $2,221 | $285,600 | $92,100 | $193,500 |
| 2019 | $2,112 | $264,600 | $86,900 | $177,700 |
| 2018 | $1,849 | $234,300 | $86,900 | $147,400 |
| 2017 | $1,820 | $221,600 | $86,900 | $134,700 |
| 2016 | $1,778 | $210,000 | $86,900 | $123,100 |
| 2015 | $1,665 | $193,200 | $84,300 | $108,900 |
| 2014 | -- | $184,200 | $81,700 | $102,500 |
Property History
| Date | Event | Price | List to Sale | Price per Sq Ft |
|---|---|---|---|---|
| 10/10/2025 10/10/25 | For Sale | $574,900 | -- | $235 / Sq Ft |
Purchase History
| Date | Type | Sale Price | Title Company |
|---|---|---|---|
| Interfamily Deed Transfer | -- | Surety Title Co | |
| Warranty Deed | -- | First American Title | |
| Quit Claim Deed | -- | -- | |
| Quit Claim Deed | $10,000 | -- | |
| Warranty Deed | -- | -- |
Mortgage History
| Date | Status | Loan Amount | Loan Type |
|---|---|---|---|
| Previous Owner | $101,250 | No Value Available | |
| Previous Owner | $99,949 | FHA |
Source: UtahRealEstate.com
MLS Number: 2116806
APN: 22-30-180-038-0000
Disclaimer: Certain information contained herein is derived from information provided by parties other than Homes.com. All information provided is deemed reliable, but is not guaranteed to be accurate and should be independently verified.
![]() IDX information is provided exclusively for consumers’ personal, non-commercial use, that it may not be used for any purpose other than to identify prospective properties consumers may be interested in purchasing, and that the data is deemed reliable but is not guaranteed accurate by the MLS. Licensor is only providing the MLS Content and not other sources of data provided in the Product.
IDX information is provided exclusively for consumers’ personal, non-commercial use, that it may not be used for any purpose other than to identify prospective properties consumers may be interested in purchasing, and that the data is deemed reliable but is not guaranteed accurate by the MLS. Licensor is only providing the MLS Content and not other sources of data provided in the Product.
Based on information from the Wasatch Front Regional Multiple Listing Service, Inc.. All data, including all measurements and calculations of area, is obtained from various sources and has not been, and will not be, verified by broker or the MLS. All information should be independently reviewed and verified for accuracy. Properties may or may not be listed by the office/agent presenting the information.
- 239 E 7350 S
- 7377 S Ramanee Dr
- 7309 S Union Village Cir
- 7218 S Viansa Ct
- 7340 S 90 E
- 112 E 7420 S
- 7080 S 230 E
- 220 E Greenwood Ave
- 210 Greenwood Ave Unit 102
- 7464 S Union Mill Ct
- 7170 S 420 E
- 7187 S 420 E
- 235 E 7615 S
- 7045 S 65 E
- 7359 S Dewmar Ct W Unit 32
- 7352 S Dewmar Ct W Unit 43
- 7367 S Dewmar Ct W Unit 34
- 7341 S Seven Tree Ln W Unit 80
- 7360 S Dewmar Ct W Unit 41
- 7363 S Dewmar Ct W Unit 33
- 7400 S State St
- 7531 S Birch St W
- 7525 Birch St
- 6960 S State St
- 579 E Connie Dr
- 6876 S 90 E Unit B
- 135 W Plum Tree Ln
- 80 E 7800 S
- 7690 S Center Square
- 7860 Citori Dr
- 7304 S Cottonwood W
- 76 W Lester Avenue 6790 S
- 837 E Chadds Ford Ln
- 6799 S Sun Rock Cove
- 7351 S Catalpa St
- 880 E Canyon Ridge Way
- 942 E North Union Ave
- 632 E 6400 S
- 967 E South Union Ave
- 6945 S Well Wood Rd
