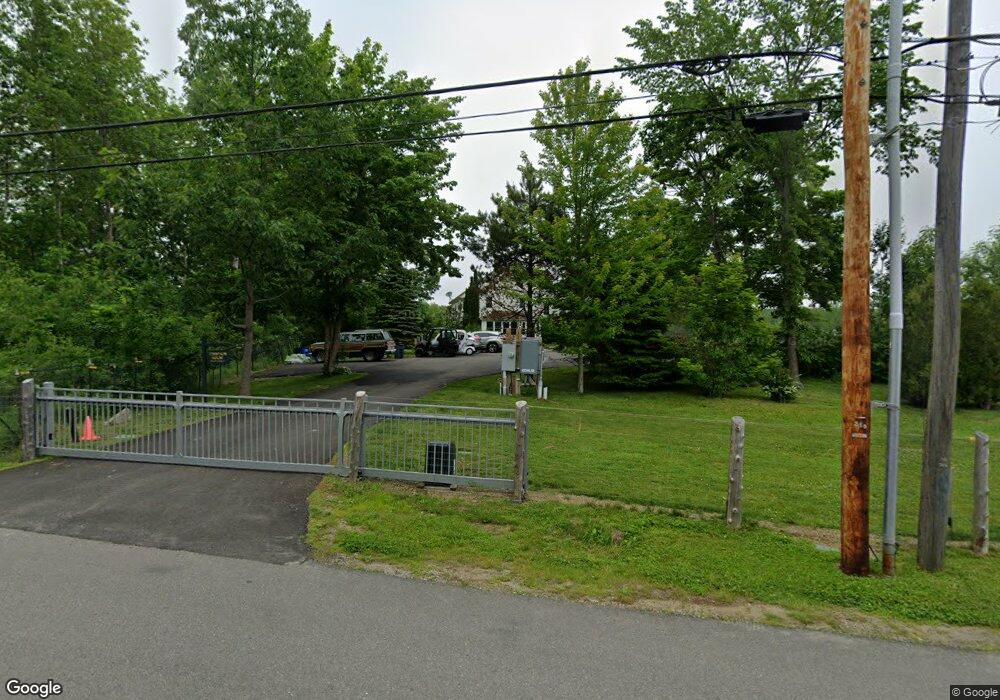
215 Cedar St Rockland, ME 04841
Estimated Value: $542,000 - $868,000
4
Beds
4
Baths
2,900
Sq Ft
$243/Sq Ft
Est. Value
About This Home
This home is located at 215 Cedar St, Rockland, ME 04841 and is currently estimated at $703,779, approximately $242 per square foot. 215 Cedar St is a home located in Knox County with nearby schools including South School, Oceanside High School East, and Pen Bay Christian School.
Ownership History
Date
Name
Owned For
Owner Type
Purchase Details
Closed on
Dec 3, 2014
Sold by
Shary Joseph C and Shary Sandra J
Bought by
Mullins Michael J
Current Estimated Value
Home Financials for this Owner
Home Financials are based on the most recent Mortgage that was taken out on this home.
Original Mortgage
$362,500
Outstanding Balance
$202,910
Interest Rate
3.93%
Mortgage Type
New Conventional
Estimated Equity
$500,869
Create a Home Valuation Report for This Property
The Home Valuation Report is an in-depth analysis detailing your home's value as well as a comparison with similar homes in the area
Home Values in the Area
Average Home Value in this Area
Purchase History
| Date | Buyer | Sale Price | Title Company |
|---|---|---|---|
| Mullins Michael J | -- | -- |
Source: Public Records
Mortgage History
| Date | Status | Borrower | Loan Amount |
|---|---|---|---|
| Open | Mullins Michael J | $362,500 |
Source: Public Records
Tax History Compared to Growth
Tax History
| Year | Tax Paid | Tax Assessment Tax Assessment Total Assessment is a certain percentage of the fair market value that is determined by local assessors to be the total taxable value of land and additions on the property. | Land | Improvement |
|---|---|---|---|---|
| 2024 | $11,601 | $473,900 | $94,200 | $379,700 |
| 2023 | $11,502 | $473,900 | $94,200 | $379,700 |
| 2022 | $10,747 | $442,800 | $94,200 | $348,600 |
| 2021 | $10,007 | $442,800 | $94,200 | $348,600 |
| 2020 | $9,874 | $442,800 | $94,200 | $348,600 |
| 2019 | $10,521 | $424,900 | $92,900 | $332,000 |
| 2018 | $9,807 | $424,900 | $92,900 | $332,000 |
| 2017 | $9,467 | $424,900 | $92,900 | $332,000 |
| 2016 | $9,059 | $417,100 | $92,900 | $324,200 |
| 2015 | $8,843 | $417,100 | $92,900 | $324,200 |
| 2014 | $8,409 | $417,100 | $92,900 | $324,200 |
| 2013 | $8,142 | $417,100 | $92,900 | $324,200 |
Source: Public Records
Map
Nearby Homes