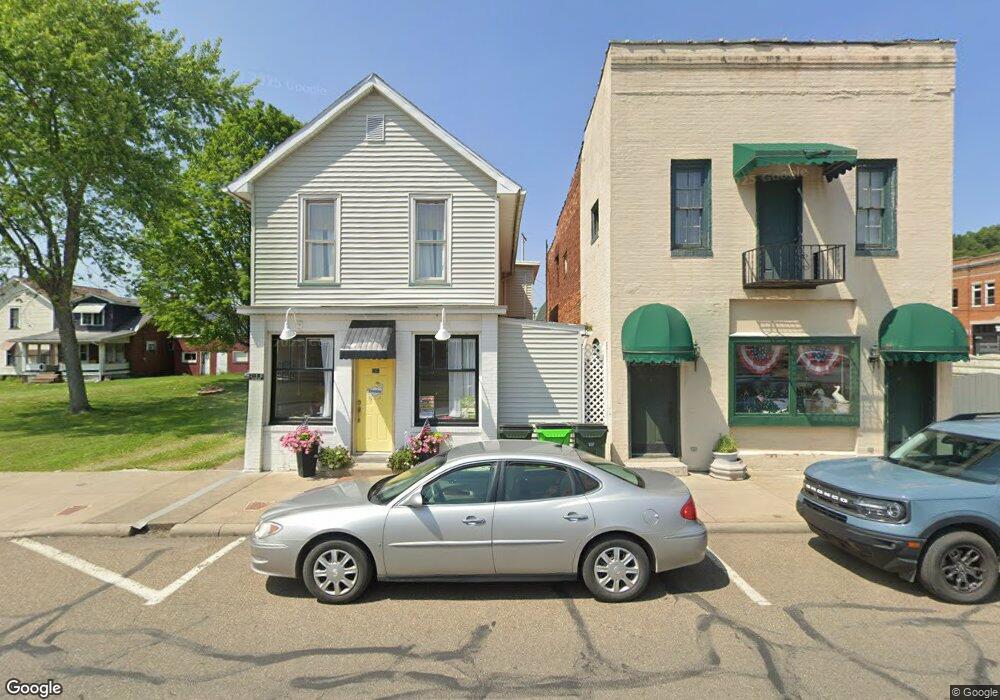
215 Center St Dennison, OH 44621
Estimated Value: $82,403 - $96,000
2
Beds
1
Bath
792
Sq Ft
$113/Sq Ft
Est. Value
About This Home
This home is located at 215 Center St, Dennison, OH 44621 and is currently estimated at $89,601, approximately $113 per square foot. 215 Center St is a home located in Tuscarawas County with nearby schools including Claymont High School and Immaculate Conception School.
Ownership History
Date
Name
Owned For
Owner Type
Purchase Details
Closed on
Aug 2, 2001
Sold by
Bonamico Shirley M
Bought by
Bonamico Jerry A
Current Estimated Value
Purchase Details
Closed on
Jun 20, 1991
Sold by
Bonamico Carmen
Bought by
Bonamico Jerry Allen
Purchase Details
Closed on
Feb 17, 1989
Bought by
Bonamico Carmen
Purchase Details
Closed on
Jan 9, 1989
Sold by
Bonamico Carmen and Bonamico Bridget
Bought by
Bonamico Carmen & 3 Others
Purchase Details
Closed on
Jun 16, 1988
Sold by
Bonamico Nunzio and Bonamico Carmen
Bought by
Bonamico Jerry Allen and Bonamico Bridget
Create a Home Valuation Report for This Property
The Home Valuation Report is an in-depth analysis detailing your home's value as well as a comparison with similar homes in the area
Home Values in the Area
Average Home Value in this Area
Purchase History
| Date | Buyer | Sale Price | Title Company |
|---|---|---|---|
| Bonamico Jerry A | $20,000 | -- | |
| Bonamico Jerry Allen | -- | -- | |
| Bonamico Carmen | $17,000 | -- | |
| Bonamico Carmen & 3 Others | -- | -- | |
| Bonamico Jerry Allen | -- | -- |
Source: Public Records
Tax History
| Year | Tax Paid | Tax Assessment Tax Assessment Total Assessment is a certain percentage of the fair market value that is determined by local assessors to be the total taxable value of land and additions on the property. | Land | Improvement |
|---|---|---|---|---|
| 2024 | $467 | $12,780 | $1,360 | $11,420 |
| 2023 | $467 | $36,500 | $3,880 | $32,620 |
| 2022 | $471 | $12,775 | $1,358 | $11,417 |
| 2021 | $447 | $11,302 | $1,029 | $10,273 |
| 2020 | $456 | $11,302 | $1,029 | $10,273 |
| 2019 | $436 | $11,302 | $1,029 | $10,273 |
| 2018 | $398 | $9,540 | $870 | $8,670 |
| 2017 | $408 | $9,540 | $870 | $8,670 |
| 2016 | $406 | $9,540 | $870 | $8,670 |
| 2014 | $374 | $8,730 | $830 | $7,900 |
| 2013 | $380 | $8,730 | $830 | $7,900 |
Source: Public Records
Map
Nearby Homes
Your Personal Tour Guide
Ask me questions while you tour the home.