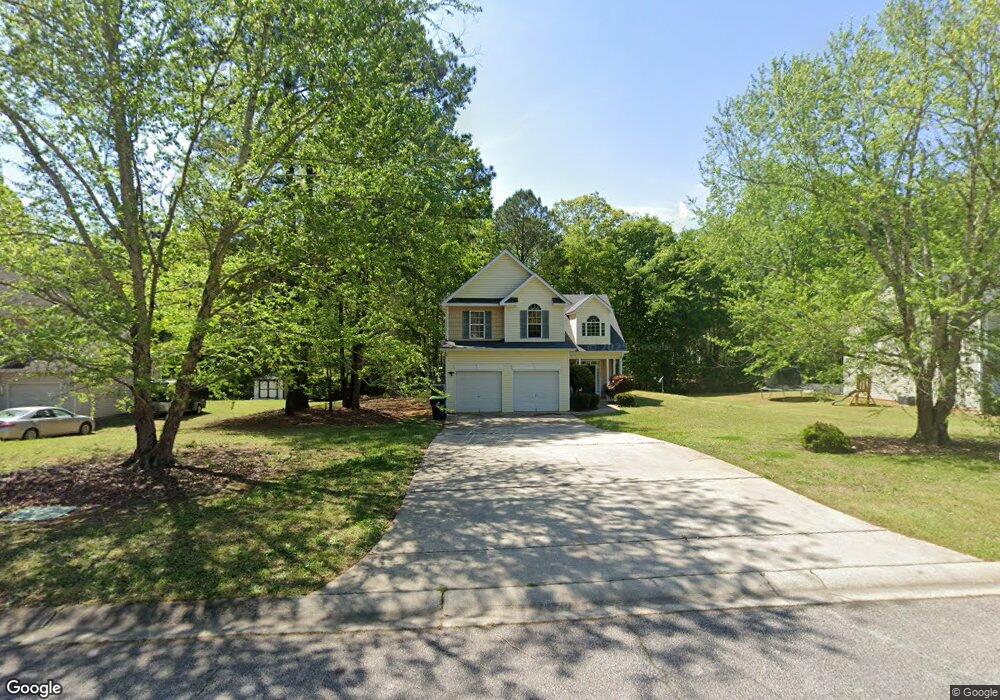
215 Cody Dr Unit 16 Griffin, GA 30223
Spalding County NeighborhoodEstimated Value: $217,000 - $244,864
3
Beds
3
Baths
1,728
Sq Ft
$135/Sq Ft
Est. Value
About This Home
This home is located at 215 Cody Dr Unit 16, Griffin, GA 30223 and is currently estimated at $233,466, approximately $135 per square foot. 215 Cody Dr Unit 16 is a home located in Spalding County with nearby schools including Cowan Road Elementary School, Cowan Road Middle School, and Griffin High School.
Ownership History
Date
Name
Owned For
Owner Type
Purchase Details
Closed on
Jul 5, 2019
Sold by
Leutza Matthew C
Bought by
Richardson Ashley
Current Estimated Value
Home Financials for this Owner
Home Financials are based on the most recent Mortgage that was taken out on this home.
Original Mortgage
$123,717
Outstanding Balance
$107,937
Interest Rate
3.62%
Mortgage Type
FHA
Estimated Equity
$125,529
Purchase Details
Closed on
Feb 15, 2017
Sold by
Sheirling Mohsen Frank
Bought by
Leutza Matthew C and Matthew C 2010 Leutza Trust
Purchase Details
Closed on
Aug 25, 2012
Sold by
Sheirling Melissa G
Bought by
Sheirling Moshen F
Purchase Details
Closed on
Jun 14, 2012
Sold by
Sheirling Melissa G
Bought by
Sheirling Mohsen F
Purchase Details
Closed on
Oct 14, 2008
Sold by
G T Architecture Contractors C
Bought by
Sheirling Mohsen F and Sheirling Azam M
Home Financials for this Owner
Home Financials are based on the most recent Mortgage that was taken out on this home.
Original Mortgage
$108,567
Interest Rate
6.34%
Mortgage Type
FHA
Create a Home Valuation Report for This Property
The Home Valuation Report is an in-depth analysis detailing your home's value as well as a comparison with similar homes in the area
Home Values in the Area
Average Home Value in this Area
Purchase History
| Date | Buyer | Sale Price | Title Company |
|---|---|---|---|
| Richardson Ashley | $126,000 | -- | |
| Leutza Matthew C | $82,000 | -- | |
| Leutza Matthew C | $82,000 | -- | |
| Sheirling Moshen F | -- | -- | |
| Sheirling Mohsen F | -- | -- | |
| Sheirling Mohsen F | $110,000 | -- |
Source: Public Records
Mortgage History
| Date | Status | Borrower | Loan Amount |
|---|---|---|---|
| Open | Richardson Ashley | $123,717 | |
| Previous Owner | Sheirling Mohsen F | $108,567 |
Source: Public Records
Tax History Compared to Growth
Tax History
| Year | Tax Paid | Tax Assessment Tax Assessment Total Assessment is a certain percentage of the fair market value that is determined by local assessors to be the total taxable value of land and additions on the property. | Land | Improvement |
|---|---|---|---|---|
| 2024 | $2,828 | $80,846 | $8,000 | $72,846 |
| 2023 | $2,828 | $80,846 | $8,000 | $72,846 |
| 2022 | $2,341 | $66,178 | $6,000 | $60,178 |
| 2021 | $1,879 | $53,493 | $6,000 | $47,493 |
| 2020 | $1,605 | $45,775 | $6,000 | $39,775 |
| 2019 | $1,345 | $36,133 | $6,000 | $30,133 |
| 2018 | $1,270 | $33,226 | $6,000 | $27,226 |
| 2017 | $1,008 | $27,128 | $6,000 | $21,128 |
| 2016 | $958 | $27,128 | $6,000 | $21,128 |
| 2015 | $988 | $27,128 | $6,000 | $21,128 |
| 2014 | $1,007 | $27,128 | $6,000 | $21,128 |
Source: Public Records
Map
Nearby Homes
- 208 Tyler Trace
- 441 Hickory Ln
- 611A Seminole Dr
- 1548 Fleetwood Dr
- 313 Sammy Cir
- 111 Patterson Rd
- 310 Sunset Dr
- 813 Vineyard Rd
- 78 Helen Dr
- 110 Janie Ln
- 130 N Morgan Dr
- 205 Westmoreland Dr
- 1022 Serene Lake Dr
- 111 Vineyard Rd
- 2407 Old Atlanta Rd
- 1643 Hallmark Hills Dr
- 1652 Hallmark Hills Dr
- 204 Vineyard Ridge Dr
- 114 King Richard Dr
- 304 Kilgore Rd