NOT LISTED FOR SALE

215 Couper St NE Rome, GA 30161

Estimated Value: $125,000 - $145,833

2 Beds
1 Bath
1,036 Sq Ft
$130/Sq Ft Est. Value

Last Sold November 18, 2019

Last sale price $65,000 $63 Per Sq Ft

Est. 106% increase in value since last sale

Current estimated payment $846/month

About This Home

As of November 2019

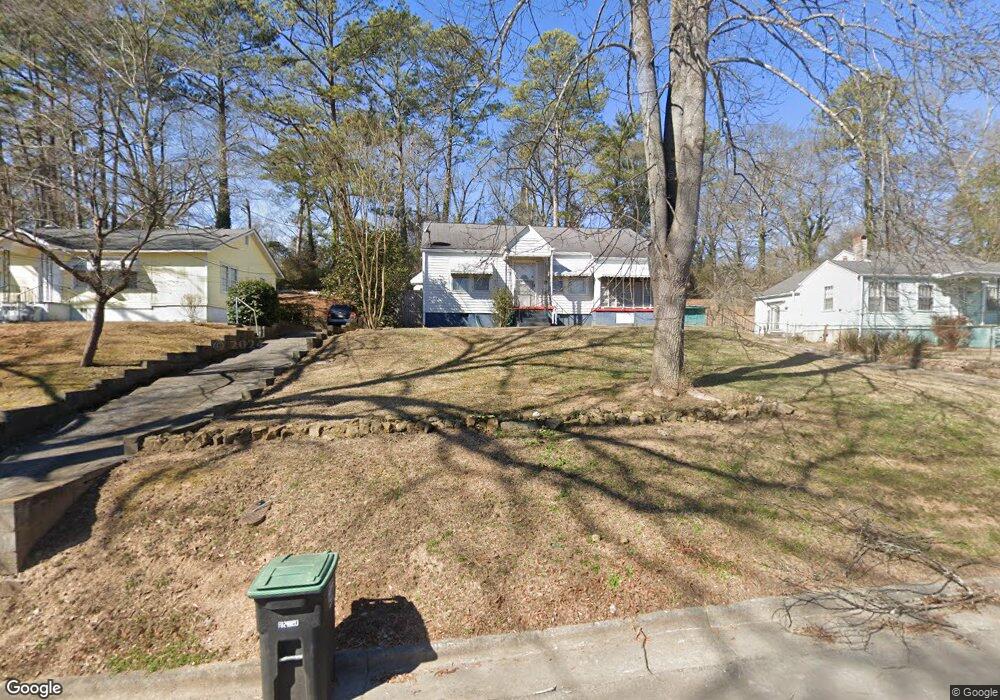
Great investment property! 2 Bedroom and 1 Bath cottage located in North Rome with loads of potential! It includes a 12 x 16 ft storage building.

Ownership History

Date Name Owned For Owner Type

Purchase Details

Listed on
Oct 14, 2019
Closed on
Nov 18, 2019
Sold by
Bradley Scott A
Bought by
Fufi Llc
Seller's Agent
Brad Cargle
Cargle & Allen Realty Group, LLC
Buyer's Agent
Elizabeth Powell
Keller Williams Realty Northwest, LLC.
List Price
$64,900
Sold Price
$65,000
Premium/Discount to List
$100
0.15%
Current Estimated Value
$134,208

Home Financials for this Owner

Home Financials are based on the most recent Mortgage that was taken out on this home.
Estimated Appreciation
$69,208
Avg. Annual Appreciation
13.00%

Purchase Details

Closed on
Apr 17, 2001
Bought by
P and R

Purchase Details

Closed on
Mar 18, 1996
Sold by
Tillery D A
Bought by
Tillery Donald A Trust Donna J Collier T

Purchase Details

Closed on
Jan 1, 1901
Bought by
Tillery D A
Source: Public Records

Range of Values:

Collateral Analytics

Collateral Analytics Collateral Analytics AVMs (Automated Valuation Model) employ a number of statistical approaches combined with neighborhood-specific comparable selection guarantees the most up-to-date and precise valuations.

Not Available

Collateral Analytics does not have data for the current month. Please view the chart for historical values.

ICE

ICE Mortgage Technology ICE Mortgage Technology’s AVM (Automated Valuation Model) is a state-of-the-art online residential property valuation tool that provides a quick and accurate estimate of the value of almost any home in the U.S.

Not Available

ICE Mortgage Technology does not have data for the current month. Please view the chart for historical values.

First American

First American First American Data & Analytics’ next-generation AVM combines unrivaled data assets with a blended ensemble of valuation models to produce highly accurate, reliable valuations you can trust.

Not Available

First American does not have data for the current month. Please view the chart for historical values.

Quantarium

Quantarium Quantarium’s valuation service, repeatedly proven the industry’s most accurate and comprehensive, is supercharged with a self-learning and auto-tuning AI engine that continually becomes smarter and more accurate as it processes daily inputs from the industry’s leading RE data lake.

Not Available

Quantarium does not have data for the current month. Please view the chart for historical values.

Average Value
Not Available
List Price
Sold Price
Create a Home Valuation Report for This Property
The Home Valuation Report is an in-depth analysis detailing your home's value as well as a comparison with similar homes in the area

Home Values in the Area

Source: Public Records

Average Home Value in this Area


Source: Public Records

Purchase History

Date Buyer Sale Price Title Company
Fufi Llc $65,000 --
P -- --
Bradley Scott A $50,000 --
Tillery Donald A Trust Donna J Collier T -- --
Tillery D A -- --
Source: Public Records

Property History

Date Event Price List to Sale Price per Sq Ft Prior Sale
11/18/2019 11/18/19 Sold $65,000 +0.2% $63 / Sq Ft View Prior Sale
10/17/2019 10/17/19 Pending -- -- --
10/14/2019 10/14/19 For Sale $64,900 -- $63 / Sq Ft

Tax History Compared to Growth

Source: Public Records

Tax History

Year Tax Paid Tax Assessment Tax Assessment Total Assessment is a certain percentage of the fair market value that is determined by local assessors to be the total taxable value of land and additions on the property. Land Improvement
2024 $1,646 $42,863 $4,902 $37,961
2023 $1,518 $41,151 $4,325 $36,826
2022 $888 $24,349 $3,460 $20,889
2021 $737 $19,863 $3,460 $16,403
2020 $682 $18,240 $2,595 $15,645
2019 $428 $13,271 $2,595 $10,676
2018 $416 $12,554 $2,595 $9,959
2017 $402 $12,135 $2,595 $9,540
2016 $390 $11,792 $2,560 $9,232
2015 $376 $11,984 $2,560 $9,424
2014 $376 $11,984 $2,560 $9,424
Source: Public Records

Agents Affiliated with this Home

  • Section Image
  • Section Image
See All Agents

Map