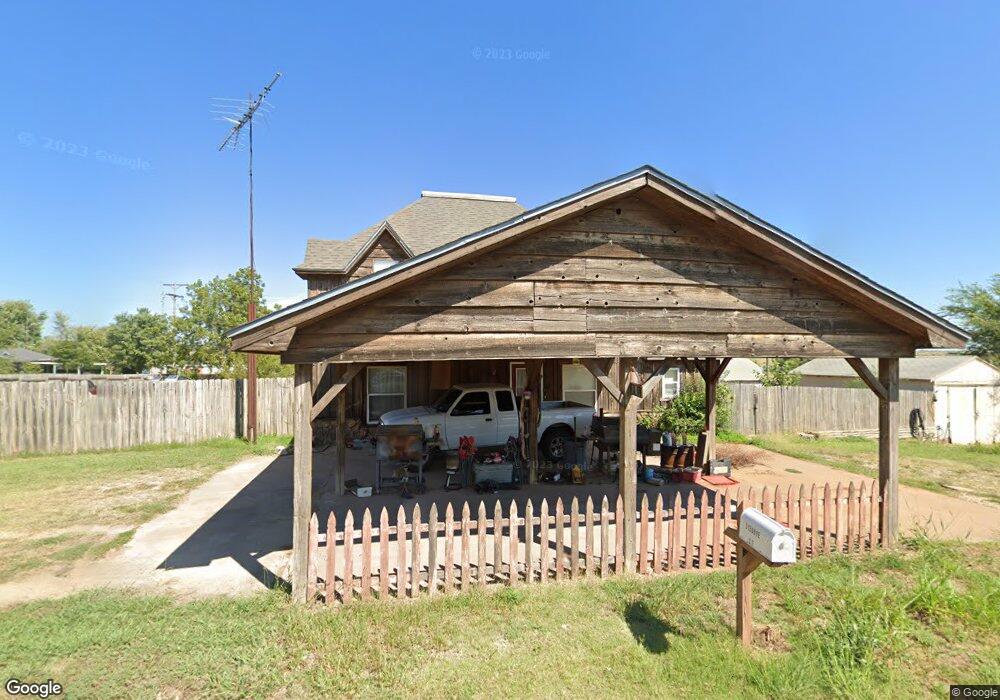
215 Dove St Lucien, OK 73757
Estimated Value: $131,075 - $394,000
3
Beds
2
Baths
2,046
Sq Ft
$101/Sq Ft
Est. Value
About This Home
This home is located at 215 Dove St, Lucien, OK 73757 and is currently estimated at $206,269, approximately $100 per square foot. 215 Dove St is a home located in Noble County with nearby schools including Covington-Douglas Elementary School and Covington-Douglas High School.
Ownership History
Date
Name
Owned For
Owner Type
Purchase Details
Closed on
Oct 25, 2016
Sold by
Tell Jason Glen and Tell Chastity Monique
Bought by
Gunterman Jason and Gunterman Jennifer
Current Estimated Value
Home Financials for this Owner
Home Financials are based on the most recent Mortgage that was taken out on this home.
Original Mortgage
$82,828
Outstanding Balance
$66,664
Interest Rate
3.5%
Mortgage Type
New Conventional
Estimated Equity
$139,605
Purchase Details
Closed on
Jul 28, 2006
Sold by
Matlock Randall L and Matlock Metenle S
Bought by
Tell Jason and Tell Chestlty
Home Financials for this Owner
Home Financials are based on the most recent Mortgage that was taken out on this home.
Original Mortgage
$64,350
Interest Rate
7.5%
Mortgage Type
Adjustable Rate Mortgage/ARM
Purchase Details
Closed on
Jun 4, 2004
Sold by
Wayne Casteel
Bought by
Randall L Matlock
Purchase Details
Closed on
Oct 25, 2002
Sold by
Marty W Casteel
Bought by
Wayne Casteel
Purchase Details
Closed on
Feb 1, 1999
Sold by
Casteel Marty W Etuxq
Bought by
Casteel Marty W
Create a Home Valuation Report for This Property
The Home Valuation Report is an in-depth analysis detailing your home's value as well as a comparison with similar homes in the area
Home Values in the Area
Average Home Value in this Area
Purchase History
| Date | Buyer | Sale Price | Title Company |
|---|---|---|---|
| Gunterman Jason | $82,000 | None Available | |
| Tell Jason | $71,500 | None Available | |
| Randall L Matlock | $40,500 | -- | |
| Wayne Casteel | -- | -- | |
| Casteel Marty W | -- | -- |
Source: Public Records
Mortgage History
| Date | Status | Borrower | Loan Amount |
|---|---|---|---|
| Open | Gunterman Jason | $82,828 | |
| Previous Owner | Tell Jason | $64,350 |
Source: Public Records
Tax History Compared to Growth
Tax History
| Year | Tax Paid | Tax Assessment Tax Assessment Total Assessment is a certain percentage of the fair market value that is determined by local assessors to be the total taxable value of land and additions on the property. | Land | Improvement |
|---|---|---|---|---|
| 2024 | $1,080 | $10,464 | $184 | $10,280 |
| 2023 | $1,003 | $10,464 | $184 | $10,280 |
| 2022 | $1,000 | $10,434 | $184 | $10,250 |
| 2021 | $983 | $10,434 | $184 | $10,250 |
| 2020 | $907 | $9,464 | $184 | $9,280 |
| 2019 | $859 | $9,013 | $184 | $8,829 |
| 2018 | $742 | $9,431 | $173 | $9,258 |
| 2017 | $827 | $9,431 | $173 | $9,258 |
| 2016 | $430 | $4,885 | $184 | $4,701 |
| 2015 | $376 | $4,653 | $184 | $4,469 |
| 2014 | $400 | $4,554 | $184 | $4,370 |
Source: Public Records
Map
Nearby Homes
- 0000 E 0510 Rd
- 000 E 0510 Dr
- 6101 Knob Hill
- 26100 County Road 60
- 000 E0510 Dr
- 0 Pioneer Unit 22691096
- 0 Pioneer Unit 1156398
- 9117 Knob Hill
- 9359 Knob Hill
- 9255 Knob Hill
- 9073 Knob Hill
- 8401 Gunsmoke
- 20652 County Road 90
- 20558 County Road 90
- 2500 W Fir St
- 208 E Quincy
- 1210 Coffey Dr
- 1205 Coffey Dr
- N N Getty Rd
- 19816 E Wheat Capital Rd