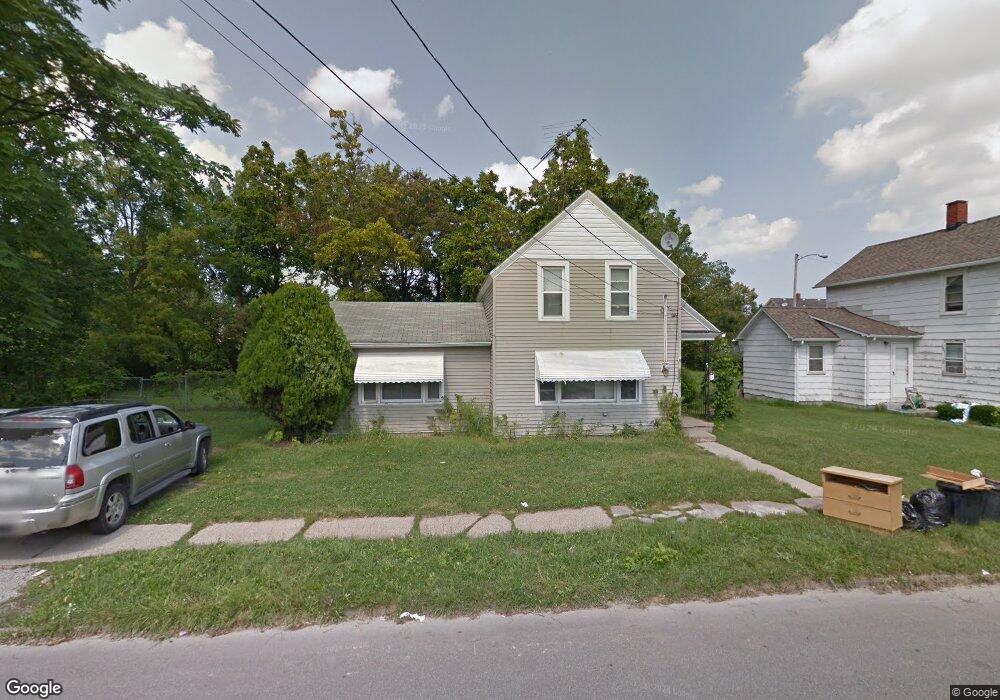
215 E 32nd St Lorain, OH 44055
Estimated Value: $66,000 - $105,005
4
Beds
1
Bath
1,272
Sq Ft
$67/Sq Ft
Est. Value
About This Home
This home is located at 215 E 32nd St, Lorain, OH 44055 and is currently estimated at $85,251, approximately $67 per square foot. 215 E 32nd St is a home located in Lorain County with nearby schools including Garfield Elementary School, Southview Middle School, and Lorain High School.
Ownership History
Date
Name
Owned For
Owner Type
Purchase Details
Closed on
Mar 7, 2025
Sold by
Spartan Acquisition Group Llc
Bought by
Alphaaxon Llc
Current Estimated Value
Home Financials for this Owner
Home Financials are based on the most recent Mortgage that was taken out on this home.
Original Mortgage
$64,000
Outstanding Balance
$63,674
Interest Rate
6.89%
Mortgage Type
New Conventional
Estimated Equity
$21,577
Purchase Details
Closed on
Apr 3, 2024
Sold by
Serenity Homes Usa Llc
Bought by
Spartan Acquisition Group Llc
Purchase Details
Closed on
Apr 10, 2006
Sold by
Hud
Bought by
Suttons Rentals Llc
Purchase Details
Closed on
Oct 5, 2005
Sold by
Garza Herlinda
Bought by
Hud
Purchase Details
Closed on
Jun 9, 2000
Sold by
Binnie Gordon and Gussie Binnie
Bought by
Garza Herlinda
Home Financials for this Owner
Home Financials are based on the most recent Mortgage that was taken out on this home.
Original Mortgage
$67,713
Interest Rate
8.66%
Mortgage Type
FHA
Create a Home Valuation Report for This Property
The Home Valuation Report is an in-depth analysis detailing your home's value as well as a comparison with similar homes in the area
Home Values in the Area
Average Home Value in this Area
Purchase History
| Date | Buyer | Sale Price | Title Company |
|---|---|---|---|
| Alphaaxon Llc | $80,000 | Revere Title | |
| Spartan Acquisition Group Llc | $5,000,000 | None Listed On Document | |
| Suttons Rentals Llc | $37,500 | Lakeside Title & Escrow Agen | |
| Hud | $34,000 | -- | |
| Garza Herlinda | -- | Insignia Title |
Source: Public Records
Mortgage History
| Date | Status | Borrower | Loan Amount |
|---|---|---|---|
| Open | Alphaaxon Llc | $64,000 | |
| Previous Owner | Garza Herlinda | $67,713 |
Source: Public Records
Tax History
| Year | Tax Paid | Tax Assessment Tax Assessment Total Assessment is a certain percentage of the fair market value that is determined by local assessors to be the total taxable value of land and additions on the property. | Land | Improvement |
|---|---|---|---|---|
| 2024 | $907 | $21,452 | $2,856 | $18,596 |
| 2023 | $826 | $15,638 | $2,713 | $12,926 |
| 2022 | $819 | $15,638 | $2,713 | $12,926 |
| 2021 | $819 | $15,638 | $2,713 | $12,926 |
| 2020 | $834 | $13,830 | $2,400 | $11,430 |
| 2019 | $829 | $13,830 | $2,400 | $11,430 |
| 2018 | $767 | $13,830 | $2,400 | $11,430 |
| 2017 | $704 | $11,070 | $2,700 | $8,370 |
| 2016 | $699 | $11,070 | $2,700 | $8,370 |
| 2015 | $660 | $11,070 | $2,700 | $8,370 |
| 2014 | $610 | $10,250 | $2,500 | $7,750 |
| 2013 | $605 | $10,250 | $2,500 | $7,750 |
Source: Public Records
Map
Nearby Homes
- 124 E 32nd St
- 3177 Elyria Ave
- 125 E 30th St
- 3011 Caroline Ave
- 2910 Caroline Ave
- V/L Broadway Ave
- 125 W 35th St
- 0 Apple Ave
- 0 Canton Ave
- 510 E 25th St
- 3058 Dayton Ave
- 319 W 27th St
- 3521 Omaha Ave
- 3323 Dallas Ave
- 112 W 25th St
- 2334 Apple Ave
- 2353 Livingston Ave
- 491 E 39th St
- 230 W 39th St
- 2349 Kelly Place
- 219 E 32nd St
- 207 E 32nd St
- 212 E 32nd St
- 216 E 32nd St
- 208 E 32nd St
- 201 E 32nd St
- 3148 Elyria Ave
- 3146 Elyria Ave
- 3146 3148 Elyria Ave
- 204 E 32nd St
- 3134 Elyria Ave
- 3206 Elyria Ave
- 3154 Elyria Ave
- 3154 3158 Elyria Ave
- 3132 Elyria Ave
- 129 E 32nd St
- 200 E 32nd St
- 208 E 31st St
- 3124 Elyria Ave
- 206 E 31st St
Your Personal Tour Guide
Ask me questions while you tour the home.