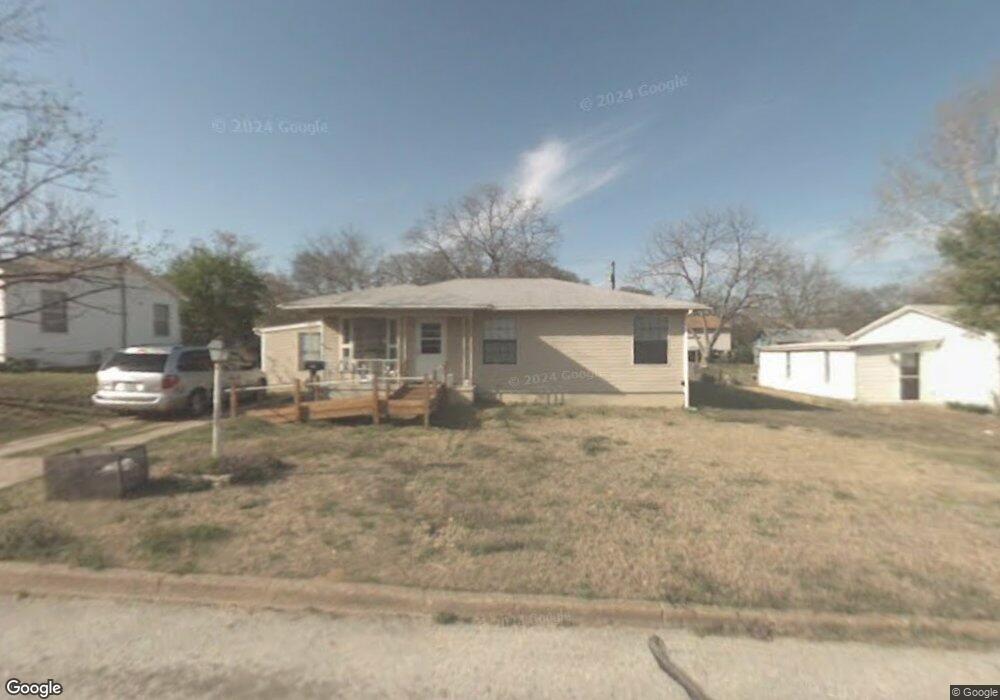
215 E Acheson St Denison, TX 75021
Estimated Value: $162,561 - $165,000
Studio
1
Bath
988
Sq Ft
$166/Sq Ft
Est. Value
About This Home
This home is located at 215 E Acheson St, Denison, TX 75021 and is currently estimated at $163,781, approximately $165 per square foot. 215 E Acheson St is a home located in Grayson County with nearby schools including Lamar Elementary School, Scott Middle School, and Denison High School.
Ownership History
Date
Name
Owned For
Owner Type
Purchase Details
Closed on
Jul 5, 2024
Sold by
Low John Daniel
Bought by
Moser Sean Michael and Moser Tiffany Yvonne
Current Estimated Value
Home Financials for this Owner
Home Financials are based on the most recent Mortgage that was taken out on this home.
Original Mortgage
$150,350
Outstanding Balance
$148,537
Interest Rate
6.94%
Mortgage Type
New Conventional
Estimated Equity
$15,244
Purchase Details
Closed on
Jul 19, 2019
Sold by
Wilson Eva Jo
Bought by
Low John Daniel
Purchase Details
Closed on
Apr 24, 2007
Sold by
Jp Morgan Chase Bank
Bought by
Wilson Eva
Purchase Details
Closed on
Mar 6, 2007
Sold by
Fenn Johnny R and Fenn Aline J
Bought by
The Bank Of New York Trust Co Na and Jpmorgan Chase Bank
Create a Home Valuation Report for This Property
The Home Valuation Report is an in-depth analysis detailing your home's value as well as a comparison with similar homes in the area
Home Values in the Area
Average Home Value in this Area
Purchase History
| Date | Buyer | Sale Price | Title Company |
|---|---|---|---|
| Moser Sean Michael | -- | None Listed On Document | |
| Low John Daniel | -- | None Available | |
| Wilson Eva | -- | Alamo Fidelity Title | |
| The Bank Of New York Trust Co Na | $21,700 | None Available |
Source: Public Records
Mortgage History
| Date | Status | Borrower | Loan Amount |
|---|---|---|---|
| Open | Moser Sean Michael | $150,350 |
Source: Public Records
Tax History
| Year | Tax Paid | Tax Assessment Tax Assessment Total Assessment is a certain percentage of the fair market value that is determined by local assessors to be the total taxable value of land and additions on the property. | Land | Improvement |
|---|---|---|---|---|
| 2025 | $3,819 | $163,848 | $56,448 | $107,400 |
| 2024 | $3,819 | $164,375 | $52,038 | $112,337 |
| 2023 | $3,927 | $173,314 | $61,838 | $111,476 |
| 2022 | $3,192 | $134,333 | $31,556 | $102,777 |
| 2021 | $2,459 | $97,505 | $17,150 | $80,355 |
| 2020 | $2,060 | $96,024 | $17,150 | $78,874 |
| 2019 | $1,953 | $89,167 | $11,564 | $77,603 |
| 2018 | $1,790 | $70,090 | $7,840 | $62,250 |
| 2017 | $1,641 | $58,665 | $4,508 | $54,157 |
| 2016 | $1,561 | $56,433 | $2,400 | $54,033 |
| 2015 | $287 | $50,713 | $2,400 | $48,313 |
| 2014 | $399 | $46,182 | $2,400 | $43,782 |
Source: Public Records
Map
Nearby Homes
- 214 E Acheson St
- 101 E Murray St
- 108 W Acheson St
- 1506 S Travis St
- TBD Bells Dr
- 232 E Prospect St
- 228 E Prospect St
- 429 E Hanna St
- 104 E Prospect St
- 625 E Murray St
- 1901 S Lamar Ave
- 1903 S Lamar Ave
- 1800 S Center St
- 1905 S Lamar Ave
- 129 Texas E
- 512 E Heron St
- 1917 Avenue A
- 516 E Heron St
- 100 W Hull St
- 328 W Murray St
- 205 E Acheson St
- 219 E Acheson St
- 225 E Acheson St
- 201 E Acheson St
- 216 E Murray St
- 208 E Murray St
- 218 E Acheson St
- 208 E Acheson St
- 231 E Acheson St
- 1400 S Lamar Ave
- 222 E Acheson St
- 200 E Acheson St
- 226 E Murray St
- 1417 S Lamar Ave
- 1413 S Lamar Ave
- 226 E Acheson St
- 130 E Murray St
- 1419 S Lamar Ave
- 1421 S Lamar Ave
- 126 E Murray St
Your Personal Tour Guide
Ask me questions while you tour the home.