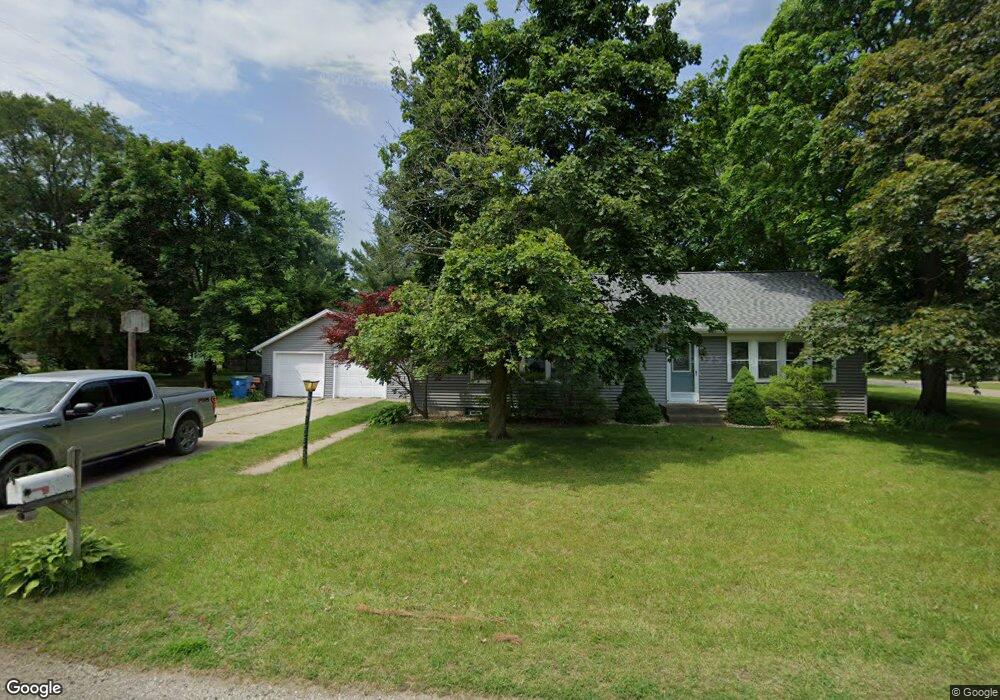
215 E Cherry St Wayland, MI 49348
Estimated Value: $267,003 - $281,000
2
Beds
1
Bath
1,460
Sq Ft
$187/Sq Ft
Est. Value
About This Home
This home is located at 215 E Cherry St, Wayland, MI 49348 and is currently estimated at $272,751, approximately $186 per square foot. 215 E Cherry St is a home located in Allegan County with nearby schools including Wayland High School and St. Therese Catholic School.
Ownership History
Date
Name
Owned For
Owner Type
Purchase Details
Closed on
Dec 11, 2020
Sold by
Balfoort Kateleen
Bought by
Balfoort Kateleen M and Balfoort Benjamin J
Current Estimated Value
Purchase Details
Closed on
Nov 10, 2004
Sold by
The Arthur Vanderweide Revocable Trust and Vanderweide Arthur
Bought by
Balfoort Kateleen
Home Financials for this Owner
Home Financials are based on the most recent Mortgage that was taken out on this home.
Original Mortgage
$105,000
Interest Rate
5.86%
Mortgage Type
Purchase Money Mortgage
Purchase Details
Closed on
Nov 5, 2003
Sold by
Zwack Kelly
Bought by
Balfoort Kateleen
Purchase Details
Closed on
Feb 6, 2002
Sold by
Weide Arthur Vander and Weide Janet Martin Vander
Bought by
Weide Arthur Vander
Create a Home Valuation Report for This Property
The Home Valuation Report is an in-depth analysis detailing your home's value as well as a comparison with similar homes in the area
Home Values in the Area
Average Home Value in this Area
Purchase History
| Date | Buyer | Sale Price | Title Company |
|---|---|---|---|
| Balfoort Kateleen M | -- | None Available | |
| Balfoort Kateleen | -- | Land Title | |
| Balfoort Kateleen | $110,000 | -- | |
| Balfoort Kateleen | -- | Metropolitan Title Co | |
| Weide Arthur Vander | -- | -- |
Source: Public Records
Mortgage History
| Date | Status | Borrower | Loan Amount |
|---|---|---|---|
| Previous Owner | Balfoort Kateleen | $105,000 |
Source: Public Records
Tax History
| Year | Tax Paid | Tax Assessment Tax Assessment Total Assessment is a certain percentage of the fair market value that is determined by local assessors to be the total taxable value of land and additions on the property. | Land | Improvement |
|---|---|---|---|---|
| 2025 | $2,566 | $117,000 | $19,500 | $97,500 |
| 2024 | $2,332 | $105,400 | $15,600 | $89,800 |
| 2023 | $2,332 | $88,100 | $14,300 | $73,800 |
| 2022 | $2,332 | $79,900 | $14,300 | $65,600 |
| 2020 | $2,183 | $70,500 | $13,200 | $57,300 |
| 2019 | $2,085 | $67,400 | $12,100 | $55,300 |
| 2018 | $2,085 | $61,300 | $12,100 | $49,200 |
| 2017 | $0 | $62,100 | $12,100 | $50,000 |
| 2016 | $0 | $53,700 | $12,900 | $40,800 |
| 2015 | -- | $53,700 | $12,900 | $40,800 |
| 2014 | -- | $48,100 | $12,900 | $35,200 |
| 2013 | -- | $44,300 | $12,900 | $31,400 |
Source: Public Records
Map
Nearby Homes
- 146 Hanlon Ct
- 545 N Main St
- 409 W Maple St
- 110 E Sycamore St
- 203 Vine St
- 401 Anderson Dr
- 1033 Aster St
- 535 135th Ave
- 329 Lotz Ct
- 3770 Division Ave S
- 1137 Regina Trail
- 1146 Saskatoon Trail
- 0 13th St Unit 26008852
- 986 129th Ave
- 4243 Butternut Dr
- 4245 Butternut Dr
- 4249 Butternut Dr
- Lot 120 Old Farm Dr
- 4279 Highpoint Dr
- Lot 131 Butternut Dr
- 321 N Locust St
- 310 Forrest St
- 323 N Locust St
- 316 N Locust St
- 304 N Locust St
- 320 Forrest St
- 318 N Locust St
- 224 Forrest St
- 216 E Cherry St
- 236 N Locust St
- 320 N Locust St
- 220 Forrest St
- 324 Forrest St
- 325 N Locust St
- 328 N Locust St
- 220 N Locust St
- 315 Lorene St
- 317 Lorene St
- 313 Lorene St
- 319 Lorene St
Your Personal Tour Guide
Ask me questions while you tour the home.