Estimated Value: $118,000 - $136,000
3
Beds
2
Baths
1,290
Sq Ft
$99/Sq Ft
Est. Value
About This Home
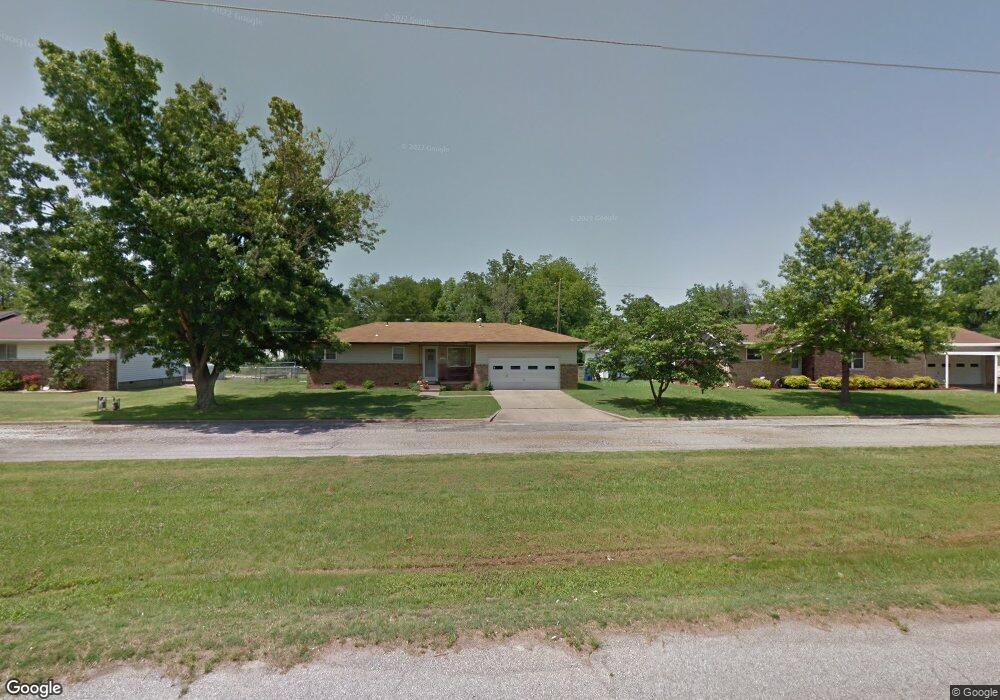
This home is located at 215 E Miami Blvd, Miami, OK 74354 and is currently estimated at $127,233, approximately $98 per square foot. 215 E Miami Blvd is a home located in Ottawa County with nearby schools including Miami High School and Mt. Olive Lutheran School.
Ownership History
Date
Name
Owned For
Owner Type
Purchase Details
Closed on
Mar 10, 2010
Sold by
Viola Keith Kenneth Dewayne and Viola Keith Lillie
Bought by
Keith Kenneth D and Keith Lillie V
Current Estimated Value
Purchase Details
Closed on
Aug 14, 2006
Sold by
Harrison Ina M
Bought by
Viola Keith Kenneth Dewayne and Viola Keith Lillie
Home Financials for this Owner
Home Financials are based on the most recent Mortgage that was taken out on this home.
Original Mortgage
$56,500
Outstanding Balance
$33,783
Interest Rate
6.78%
Mortgage Type
New Conventional
Estimated Equity
$93,450
Create a Home Valuation Report for This Property
The Home Valuation Report is an in-depth analysis detailing your home's value as well as a comparison with similar homes in the area
Purchase History
| Date | Buyer | Sale Price | Title Company |
|---|---|---|---|
| Keith Kenneth D | -- | None Available | |
| Viola Keith Kenneth Dewayne | $76,300 | None Available |
Source: Public Records
Mortgage History
| Date | Status | Borrower | Loan Amount |
|---|---|---|---|
| Open | Viola Keith Kenneth Dewayne | $56,500 |
Source: Public Records
Tax History
| Year | Tax Paid | Tax Assessment Tax Assessment Total Assessment is a certain percentage of the fair market value that is determined by local assessors to be the total taxable value of land and additions on the property. | Land | Improvement |
|---|---|---|---|---|
| 2025 | -- | $10,454 | $741 | $9,713 |
| 2024 | -- | $11,191 | $741 | $10,450 |
| 2023 | $0 | $10,865 | $741 | $10,124 |
| 2022 | $0 | $10,699 | $741 | $9,958 |
| 2021 | $982 | $10,388 | $741 | $9,647 |
| 2020 | $961 | $10,085 | $741 | $9,344 |
| 2019 | $0 | $10,710 | $739 | $9,971 |
| 2018 | $0 | $10,398 | $732 | $9,666 |
| 2017 | $0 | $10,096 | $726 | $9,370 |
| 2016 | $422 | $9,615 | $741 | $8,874 |
| 2015 | $422 | $4,750 | $554 | $4,196 |
| 2014 | $750 | $9,157 | $741 | $8,416 |
Source: Public Records
Map
Nearby Homes
Your Personal Tour Guide
Ask me questions while you tour the home.