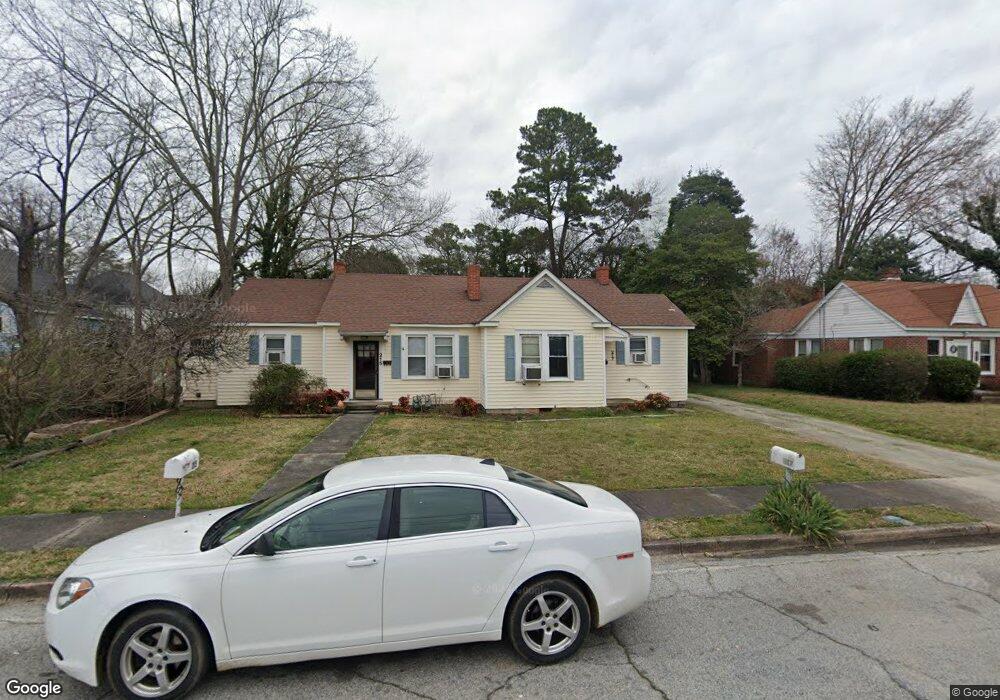
215 Edwards St Elberton, GA 30635
Estimated Value: $114,050 - $145,000
--
Bed
2
Baths
1,540
Sq Ft
$85/Sq Ft
Est. Value
About This Home
This home is located at 215 Edwards St, Elberton, GA 30635 and is currently estimated at $131,513, approximately $85 per square foot. 215 Edwards St is a home located in Elbert County with nearby schools including Elbert County Primary School, Elbert County Elementary School, and Elbert County Middle School.
Ownership History
Date
Name
Owned For
Owner Type
Purchase Details
Closed on
Jul 6, 2018
Sold by
Seymour Fam Trust
Bought by
Lee Vaughn B and Oreo Properties Llc
Current Estimated Value
Home Financials for this Owner
Home Financials are based on the most recent Mortgage that was taken out on this home.
Original Mortgage
$60,300
Outstanding Balance
$36,486
Interest Rate
4.5%
Mortgage Type
New Conventional
Estimated Equity
$95,027
Purchase Details
Closed on
Oct 21, 2010
Sold by
Seymour Carol G
Bought by
Herring Sissie Trustee Of The Seymour
Purchase Details
Closed on
Jun 30, 1989
Sold by
Mcallister Ralph E and Mcallist Blondean L
Bought by
Veal Tom Ed
Purchase Details
Closed on
Apr 29, 1988
Sold by
Veal Tom Ed Aka Thomas Edward Veal
Bought by
Seymour Carol G
Purchase Details
Closed on
Mar 4, 1979
Sold by
Haslett Sara Estate
Bought by
Mcallister Ralph E and Mcallister Blondean L
Create a Home Valuation Report for This Property
The Home Valuation Report is an in-depth analysis detailing your home's value as well as a comparison with similar homes in the area
Home Values in the Area
Average Home Value in this Area
Purchase History
| Date | Buyer | Sale Price | Title Company |
|---|---|---|---|
| Lee Vaughn B | $67,000 | -- | |
| Herring Sissie Trustee Of The Seymour | -- | -- | |
| Veal Tom Ed | $30,000 | -- | |
| Mcallister Ralph E | -- | -- | |
| Seymour Carol G | $51,000 | -- | |
| Mcallister Ralph E | $38,000 | -- |
Source: Public Records
Mortgage History
| Date | Status | Borrower | Loan Amount |
|---|---|---|---|
| Open | Lee Vaughn B | $60,300 |
Source: Public Records
Tax History Compared to Growth
Tax History
| Year | Tax Paid | Tax Assessment Tax Assessment Total Assessment is a certain percentage of the fair market value that is determined by local assessors to be the total taxable value of land and additions on the property. | Land | Improvement |
|---|---|---|---|---|
| 2024 | $1,130 | $45,926 | $4,906 | $41,020 |
| 2023 | $673 | $27,370 | $4,906 | $22,464 |
| 2022 | $659 | $26,800 | $4,906 | $21,894 |
| 2021 | $664 | $26,800 | $4,906 | $21,894 |
| 2020 | $739 | $26,800 | $4,906 | $21,894 |
| 2019 | $763 | $26,800 | $4,906 | $21,894 |
| 2018 | $792 | $26,800 | $4,906 | $21,894 |
| 2017 | $830 | $26,410 | $4,906 | $21,504 |
| 2016 | $775 | $26,410 | $4,906 | $21,504 |
| 2015 | -- | $26,410 | $4,906 | $21,504 |
| 2014 | -- | $26,410 | $4,906 | $21,504 |
| 2013 | -- | $26,256 | $4,906 | $21,350 |
Source: Public Records
Map
Nearby Homes
- 245 Edwards St
- 105 S Thomas St
- 252 Edwards St
- 120 S Tusten St
- 2790 Cedar Creek Rd
- 196 S Oliver St
- 968 Ext Elbert St
- 62 Oak St
- 0 Oak Dr Unit 7643600
- 0 Oak Dr Unit 10598083
- 118 Oak Dr
- 108 Brookhaven Cir
- 135 Brookside Dr
- 173 Brookside Dr
- 89 College Ave
- 181 Brookside Dr
- 214 Campbell St
- 415 Athenia St
- 136 Forest Ave
- 143 Lake Forest Cir
- 219 Edwards St
- 159 S Thomas St
- 153 S Thomas St
- 147 S Thomas St
- 221 Edwards St
- 206 Edwards St
- 140 Myrtle St
- 141 S Thomas St
- 0 Thomas St Unit 8683380
- 0 Thomas St Unit 8623756
- 0 Thomas St Unit 8040643
- 0 Thomas St Unit 7193744
- S Thomas St
- 138 Myrtle St
- 210 Edwards St
- 202 Edwards St
- 216 Edwards St
- 144 Myrtle St
- 134 Myrtle St
- 150 S Thomas St