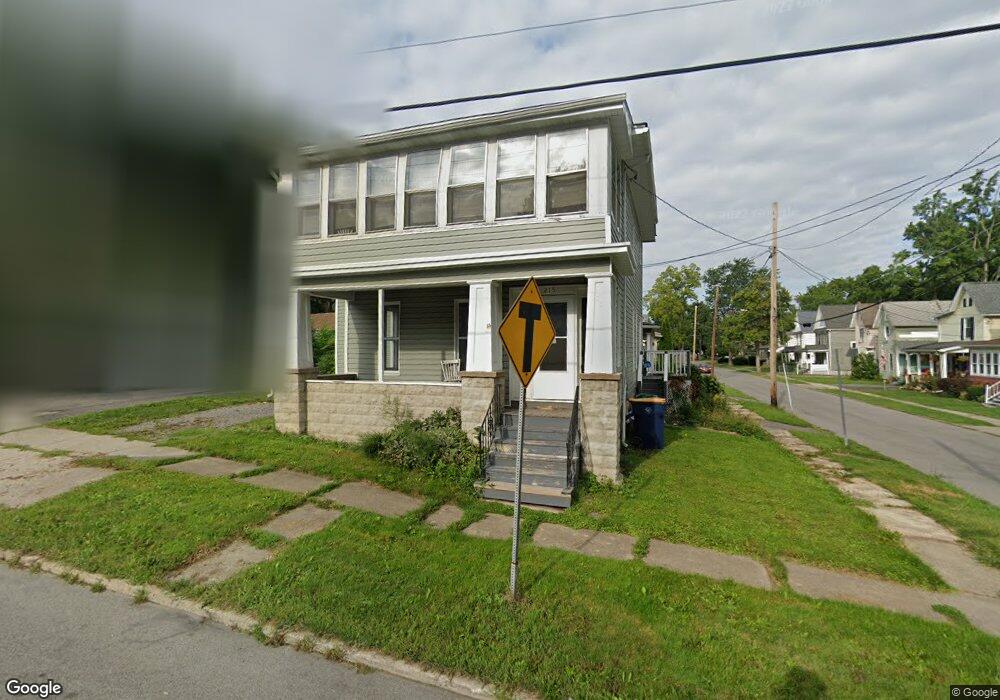
215 Erie St Unit lower Lockport, NY 14094
Estimated Value: $159,000 - $184,333
3
Beds
2
Baths
1,440
Sq Ft
$120/Sq Ft
Est. Value
About This Home
This home is located at 215 Erie St Unit lower, Lockport, NY 14094 and is currently estimated at $172,583, approximately $119 per square foot. 215 Erie St Unit lower is a home located in Niagara County with nearby schools including Aaron Mossell Junior High School, Lockport High School, and DeSales Catholic School.
Ownership History
Date
Name
Owned For
Owner Type
Purchase Details
Closed on
Jun 26, 2024
Sold by
Panasiuk Vladmir
Bought by
Loebel Justin K
Current Estimated Value
Home Financials for this Owner
Home Financials are based on the most recent Mortgage that was taken out on this home.
Original Mortgage
$131,250
Outstanding Balance
$129,694
Interest Rate
7.03%
Mortgage Type
New Conventional
Estimated Equity
$42,889
Purchase Details
Closed on
Sep 5, 1995
Sold by
Wolcott Clyde F and Wolcott Betty C
Bought by
Faery John L and Faery Tracy L
Create a Home Valuation Report for This Property
The Home Valuation Report is an in-depth analysis detailing your home's value as well as a comparison with similar homes in the area
Home Values in the Area
Average Home Value in this Area
Purchase History
| Date | Buyer | Sale Price | Title Company |
|---|---|---|---|
| Loebel Justin K | $175,000 | None Listed On Document | |
| Faery John L | $42,000 | -- |
Source: Public Records
Mortgage History
| Date | Status | Borrower | Loan Amount |
|---|---|---|---|
| Open | Loebel Justin K | $131,250 |
Source: Public Records
Tax History Compared to Growth
Tax History
| Year | Tax Paid | Tax Assessment Tax Assessment Total Assessment is a certain percentage of the fair market value that is determined by local assessors to be the total taxable value of land and additions on the property. | Land | Improvement |
|---|---|---|---|---|
| 2024 | $2,718 | $100,000 | $2,400 | $97,600 |
| 2023 | $2,656 | $95,000 | $2,400 | $92,600 |
| 2022 | $1,927 | $86,000 | $2,400 | $83,600 |
| 2021 | $1,483 | $37,600 | $3,100 | $34,500 |
| 2020 | $1,451 | $37,600 | $3,100 | $34,500 |
| 2019 | $325 | $37,600 | $3,100 | $34,500 |
| 2018 | $1,049 | $37,600 | $3,100 | $34,500 |
| 2017 | $1,015 | $36,500 | $3,100 | $33,400 |
| 2016 | $217 | $36,500 | $3,100 | $33,400 |
| 2015 | -- | $36,500 | $3,100 | $33,400 |
| 2014 | -- | $36,500 | $3,100 | $33,400 |
Source: Public Records
Map
Nearby Homes