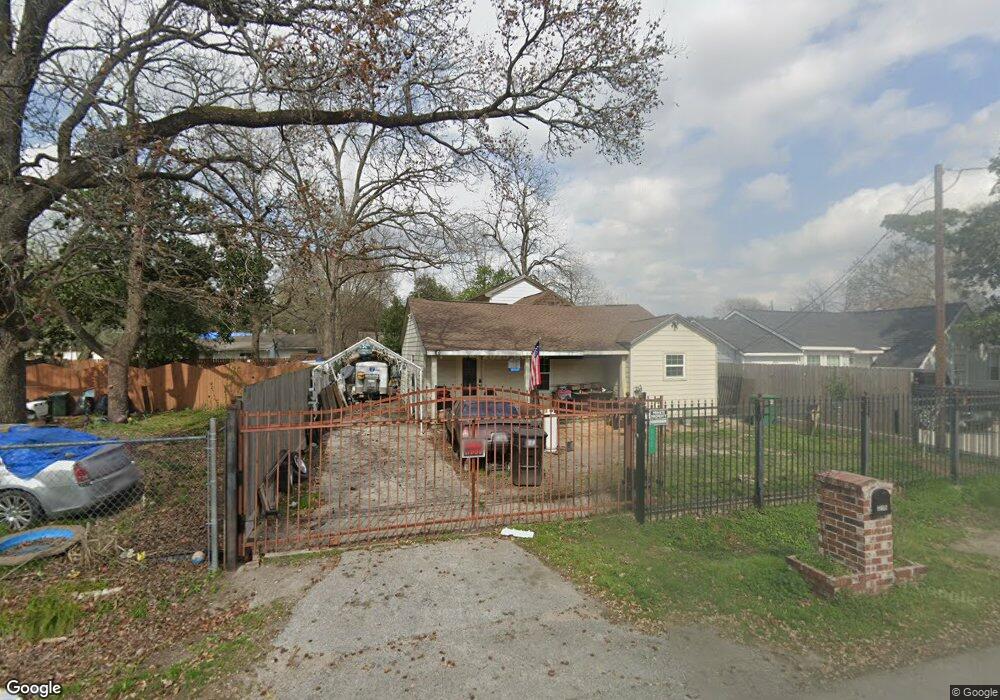
215 Fichter St Houston, TX 77022
Northside-Northline NeighborhoodEstimated Value: $172,000 - $290,000
2
Beds
1
Bath
888
Sq Ft
$287/Sq Ft
Est. Value
About This Home
This home is located at 215 Fichter St, Houston, TX 77022 and is currently estimated at $254,965, approximately $287 per square foot. 215 Fichter St is a home located in Harris County with nearby schools including Burbank Elementary School, Burbank Middle School, and Sam Houston Math, Science & Technology Center.
Ownership History
Date
Name
Owned For
Owner Type
Purchase Details
Closed on
Apr 28, 2017
Sold by
Rincon Mary Lou
Bought by
Charles Gabriel Ben and Nino Adriana
Current Estimated Value
Home Financials for this Owner
Home Financials are based on the most recent Mortgage that was taken out on this home.
Original Mortgage
$70,000
Interest Rate
4.3%
Mortgage Type
New Conventional
Purchase Details
Closed on
Sep 14, 2012
Sold by
Davis Mark Anthony and Davis Marjorie
Bought by
Rincon Mary Lou
Create a Home Valuation Report for This Property
The Home Valuation Report is an in-depth analysis detailing your home's value as well as a comparison with similar homes in the area
Home Values in the Area
Average Home Value in this Area
Purchase History
| Date | Buyer | Sale Price | Title Company |
|---|---|---|---|
| Charles Gabriel Ben | -- | Fidelity National Title | |
| Rincon Mary Lou | -- | None Available |
Source: Public Records
Mortgage History
| Date | Status | Borrower | Loan Amount |
|---|---|---|---|
| Closed | Charles Gabriel Ben | $70,000 |
Source: Public Records
Tax History Compared to Growth
Tax History
| Year | Tax Paid | Tax Assessment Tax Assessment Total Assessment is a certain percentage of the fair market value that is determined by local assessors to be the total taxable value of land and additions on the property. | Land | Improvement |
|---|---|---|---|---|
| 2025 | $3,389 | $273,451 | $76,000 | $197,451 |
| 2024 | $3,389 | $263,568 | $69,750 | $193,818 |
| 2023 | $3,389 | $312,344 | $42,500 | $269,844 |
| 2022 | $4,620 | $253,126 | $42,500 | $210,626 |
| 2021 | $4,446 | $195,190 | $42,500 | $152,690 |
| 2020 | $4,241 | $175,137 | $42,500 | $132,637 |
| 2019 | $2,701 | $106,748 | $35,000 | $71,748 |
| 2018 | $1,718 | $67,901 | $29,250 | $38,651 |
| 2017 | $2,013 | $79,609 | $29,250 | $50,359 |
| 2016 | $2,016 | $79,722 | $27,500 | $52,222 |
| 2015 | $1,742 | $67,766 | $20,000 | $47,766 |
| 2014 | $1,742 | $67,766 | $20,000 | $47,766 |
Source: Public Records
Map
Nearby Homes
- 216 Burress St
- 132 Grothe Ln
- 108 Fichter St
- 249 De Boll St
- 253 De Boll St
- 318 Charlock St
- 411 Berry Rd
- 90 Burress St Unit B
- 90 Burress St Unit A
- 9026 Mcgallion Rd
- 61 Trenwood Ln
- 88 Berry Rd
- 70 Burress St
- 56 Wellford St
- 235 Julia St Unit B
- 44 Farrell St
- 8205 Appleton St
- 45 Wellford St
- 240 Julia St Unit D
- 202 Burbank St