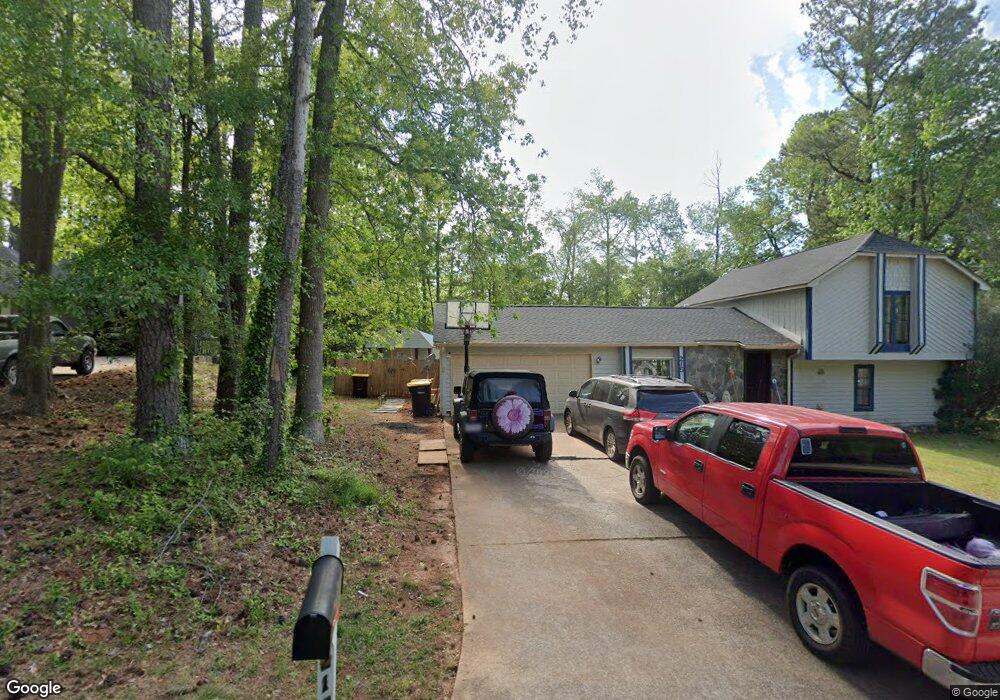
215 Fieldstone Dr Fairburn, GA 30213
Estimated Value: $199,000 - $231,000
3
Beds
3
Baths
1,234
Sq Ft
$176/Sq Ft
Est. Value
About This Home
This home is located at 215 Fieldstone Dr, Fairburn, GA 30213 and is currently estimated at $217,269, approximately $176 per square foot. 215 Fieldstone Dr is a home located in Fulton County with nearby schools including Campbell Elementary School, Renaissance Middle School, and Creekside High School.
Ownership History
Date
Name
Owned For
Owner Type
Purchase Details
Closed on
Jan 15, 2016
Sold by
Associated Partners Llc
Bought by
Metro Horizon Contractors Llc
Current Estimated Value
Purchase Details
Closed on
Jan 12, 2016
Sold by
Metro Horizon Contractors Llc
Bought by
Hbcu I Love This College Llc
Purchase Details
Closed on
Sep 4, 2012
Sold by
City Of Fairburn
Bought by
Associated Partners
Purchase Details
Closed on
Aug 30, 1999
Sold by
Fowler Paul J and Fowler Lorene M
Bought by
Thompson Johnny A and Thompson Emily R
Home Financials for this Owner
Home Financials are based on the most recent Mortgage that was taken out on this home.
Original Mortgage
$90,455
Interest Rate
7.5%
Mortgage Type
FHA
Purchase Details
Closed on
Apr 20, 1995
Sold by
Scott Harry L Vernell T
Bought by
Fowler Paul J Lorene M
Create a Home Valuation Report for This Property
The Home Valuation Report is an in-depth analysis detailing your home's value as well as a comparison with similar homes in the area
Home Values in the Area
Average Home Value in this Area
Purchase History
| Date | Buyer | Sale Price | Title Company |
|---|---|---|---|
| Metro Horizon Contractors Llc | $23,229 | -- | |
| Hbcu I Love This College Llc | $40,000 | -- | |
| Associated Partners | -- | -- | |
| Thompson Johnny A | $91,700 | -- | |
| Fowler Paul J Lorene M | $75,000 | -- |
Source: Public Records
Mortgage History
| Date | Status | Borrower | Loan Amount |
|---|---|---|---|
| Previous Owner | Thompson Johnny A | $90,455 | |
| Closed | Fowler Paul J Lorene M | $0 |
Source: Public Records
Tax History Compared to Growth
Tax History
| Year | Tax Paid | Tax Assessment Tax Assessment Total Assessment is a certain percentage of the fair market value that is determined by local assessors to be the total taxable value of land and additions on the property. | Land | Improvement |
|---|---|---|---|---|
| 2025 | $694 | $69,080 | $17,040 | $52,040 |
| 2023 | $2,050 | $72,640 | $18,160 | $54,480 |
| 2022 | $727 | $48,360 | $9,080 | $39,280 |
| 2021 | $711 | $38,040 | $5,080 | $32,960 |
| 2020 | $710 | $37,640 | $5,040 | $32,600 |
| 2019 | $353 | $36,960 | $4,960 | $32,000 |
| 2018 | $1,018 | $36,080 | $4,840 | $31,240 |
| 2017 | $434 | $14,880 | $3,600 | $11,280 |
| 2016 | $434 | $14,880 | $3,600 | $11,280 |
| 2015 | $243 | $14,880 | $3,600 | $11,280 |
| 2014 | $244 | $14,880 | $3,600 | $11,280 |
Source: Public Records
Map
Nearby Homes
- 245 Fieldstone Dr
- 7820 Marie Way
- 49 Fireside Way
- 225 Fireside Way
- 0 Fireside Way Unit 10609454
- 0 Fireside Way Unit 10609451
- 0 Fireside Way Unit 7652233
- 0 Fireside Way Unit 7652219
- 9 Camellia Dr
- 7 Camellia Dr
- 15 Camellia Dr
- 13 Camellia Dr
- 11 Camellia Dr
- 6390 Highway 92
- Layla II Plan at Enclave at Evergreen
- Reagan Plan at Enclave at Evergreen
- Emma Plan at Enclave at Evergreen
- Zoey II Plan at Enclave at Evergreen
- Millhaven Plan at Enclave at Evergreen
- 80 Hydrangea Cir
- 205 Fieldstone Dr
- 225 Fieldstone Dr
- 210 Splitwood Ln
- 220 Splitwood Ln
- 200 Splitwood Ln
- 250 Fieldstone Dr
- 195 Fieldstone Dr
- 235 Fieldstone Dr
- 260 Fieldstone Dr
- 240 Fieldstone Dr
- 0 Fieldstone Do Not Show
- 270 Fieldstone- Do Not Show
- 190 Splitwood Ln
- 185 Fieldstone Dr
- 180 Splitwood Ln
- 210 Ember Ct
- 245 Splitwood Ln
- 220 Ember Ct
- 280 Fieldstone Dr
- 230 Fieldstone Dr