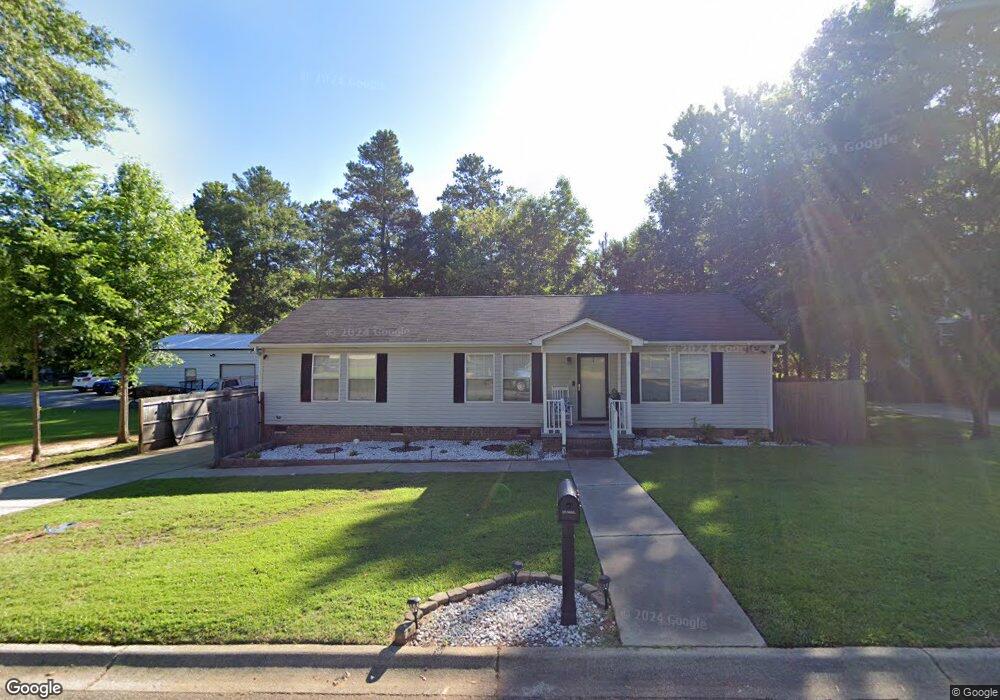
215 Forest Way Unit 8 Winnsboro, SC 29180
Estimated Value: $162,302 - $185,000
3
Beds
2
Baths
1,431
Sq Ft
$119/Sq Ft
Est. Value
About This Home
This home is located at 215 Forest Way Unit 8, Winnsboro, SC 29180 and is currently estimated at $170,326, approximately $119 per square foot. 215 Forest Way Unit 8 is a home located in Fairfield County with nearby schools including Fairfield Middle School, Fairfield Central High School, and Midlands STEM Institute.
Ownership History
Date
Name
Owned For
Owner Type
Purchase Details
Closed on
Apr 18, 2024
Sold by
Gibson Tacquetta M
Bought by
Russell Monica L
Current Estimated Value
Home Financials for this Owner
Home Financials are based on the most recent Mortgage that was taken out on this home.
Original Mortgage
$157,003
Interest Rate
6.94%
Mortgage Type
FHA
Purchase Details
Closed on
Jul 24, 2018
Sold by
Rabb Jessie
Bought by
Gibson Tacquetta M
Home Financials for this Owner
Home Financials are based on the most recent Mortgage that was taken out on this home.
Original Mortgage
$70,695
Interest Rate
4.75%
Mortgage Type
FHA
Purchase Details
Closed on
Jun 29, 2015
Sold by
Estate Of Lillian P Rabb
Bought by
Rabb Jesse
Purchase Details
Closed on
May 4, 2015
Sold by
Estate Of Lillian P Rabb
Bought by
Rabb Jesse
Create a Home Valuation Report for This Property
The Home Valuation Report is an in-depth analysis detailing your home's value as well as a comparison with similar homes in the area
Home Values in the Area
Average Home Value in this Area
Purchase History
| Date | Buyer | Sale Price | Title Company |
|---|---|---|---|
| Russell Monica L | $159,900 | None Listed On Document | |
| Gibson Tacquetta M | $72,000 | -- | |
| Rabb Jesse | -- | -- | |
| Rabb Lillian P | -- | -- | |
| Rabb Jesse | -- | -- | |
| Rabb Lillian P | -- | -- |
Source: Public Records
Mortgage History
| Date | Status | Borrower | Loan Amount |
|---|---|---|---|
| Previous Owner | Russell Monica L | $157,003 | |
| Previous Owner | Gibson Tacquetta M | $70,695 |
Source: Public Records
Tax History Compared to Growth
Tax History
| Year | Tax Paid | Tax Assessment Tax Assessment Total Assessment is a certain percentage of the fair market value that is determined by local assessors to be the total taxable value of land and additions on the property. | Land | Improvement |
|---|---|---|---|---|
| 2024 | $520 | $2,864 | $300 | $2,564 |
| 2023 | $520 | $2,864 | $300 | $2,564 |
| 2022 | $465 | $2,864 | $300 | $2,564 |
| 2021 | $466 | $2,864 | $300 | $2,564 |
| 2020 | $497 | $2,864 | $300 | $2,564 |
| 2019 | $498 | $2,868 | $300 | $2,568 |
| 2018 | $612 | $3,596 | $400 | $3,196 |
| 2017 | $2,047 | $5,394 | $0 | $0 |
| 2016 | $2,053 | $5,394 | $0 | $0 |
| 2015 | $277 | $0 | $0 | $0 |
| 2014 | $277 | $3,596 | $0 | $0 |
| 2012 | $277 | $3,596 | $0 | $0 |
Source: Public Records
Map
Nearby Homes
- 211 Chatham Cir Unit 6
- 142 Hunstanton Dr
- 750 Eighth St
- 250 Pine St
- 260 Eighth St
- 970 U S 321 Business
- 140 Eighth St
- TBD Timberlane Dr
- 129 Maple St
- 0 Kincaid Bridge Rd
- 0 W Highway 321 Unit 13387983
- 0 321 Hwy Unit 592022
- 0 W Highway 321 Unit 561990
- 0 W Highway 321 Unit 535193
- 0 W Highway 321 Unit 535192
- 0 Golf Course Rd
- 630 Fagan Rd
- 207 Calhoun St Unit 418151
- 207 Forest Hills Dr
- 104 Dogwood Ave
- 109 Forest Way Unit 7
- 209 Chatham Cir Unit 5
- 219 Forest Way Unit 10
- 131 Forest Way
- 108 Forest Way
- 226 Chatham Cir
- 203 Chatham Cir Unit 2
- 133 Forest Way
- 205 Chatham Cir
- 200 Chatham Cir
- 230 Chatham Cir Unit 24
- 127 Chatham Cir
- 222 Chatham Cir Unit 28
- 158 Chatham Cir Unit 23
- 220 Chatham Forest Cir
- 224 Chatham Cir
- 125 Chatham Cir Unit 7
- 156 Chatham Cir
- 115 Chatham Cir
- 218 Chatham Cir Unit 30