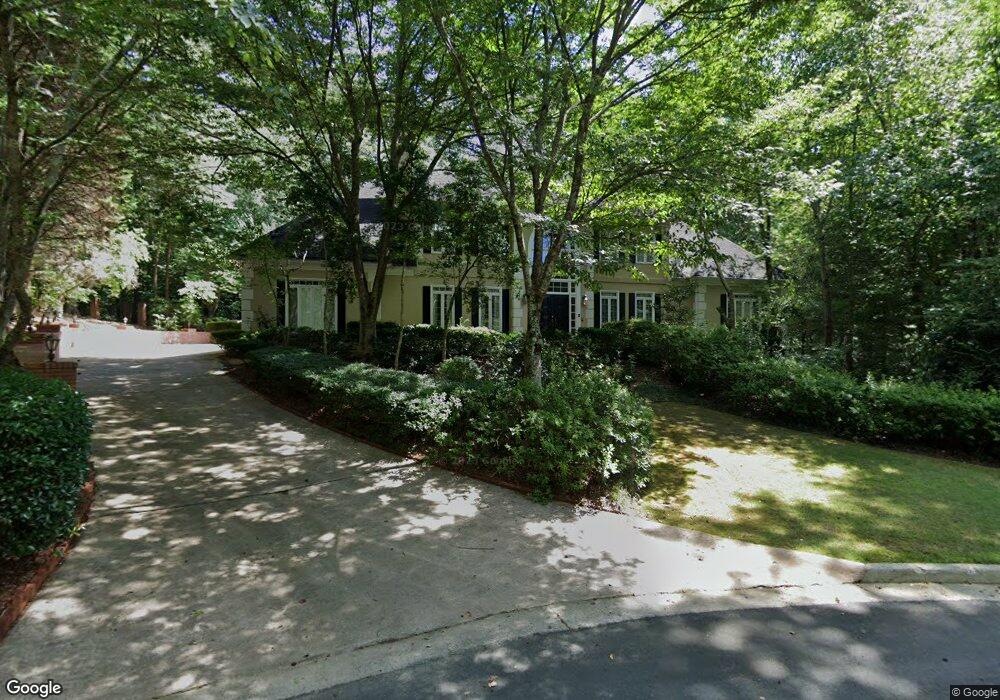
215 Frasher Way Unit 1 Duluth, GA 30097
Warsaw NeighborhoodEstimated Value: $1,035,000 - $1,251,000
5
Beds
5
Baths
4,022
Sq Ft
$275/Sq Ft
Est. Value
About This Home
This home is located at 215 Frasher Way Unit 1, Duluth, GA 30097 and is currently estimated at $1,107,098, approximately $275 per square foot. 215 Frasher Way Unit 1 is a home located in Fulton County with nearby schools including Medlock Bridge Elementary School, Autrey Mill Middle School, and Johns Creek High School.
Ownership History
Date
Name
Owned For
Owner Type
Purchase Details
Closed on
Dec 28, 2016
Sold by
Yunjung Jenny
Bought by
Kim Jenny Yunjung and Kim Sang Ki
Current Estimated Value
Purchase Details
Closed on
Sep 21, 2015
Sold by
Kim Sang Ki
Bought by
Kim Jenny Yunjung
Purchase Details
Closed on
Aug 30, 2002
Sold by
Kim Sang K
Bought by
Kim Sang K and Kim Jenny Y
Home Financials for this Owner
Home Financials are based on the most recent Mortgage that was taken out on this home.
Original Mortgage
$180,000
Interest Rate
6.19%
Mortgage Type
New Conventional
Purchase Details
Closed on
May 30, 2001
Sold by
Kim Sang K and Kim Jenny Y
Bought by
Kim Sang K
Purchase Details
Closed on
Jun 18, 1997
Sold by
Butler Brett M and Butler Eveline
Bought by
Kim Sang Ki and Kim Jenny
Home Financials for this Owner
Home Financials are based on the most recent Mortgage that was taken out on this home.
Original Mortgage
$300,000
Interest Rate
7.97%
Mortgage Type
New Conventional
Create a Home Valuation Report for This Property
The Home Valuation Report is an in-depth analysis detailing your home's value as well as a comparison with similar homes in the area
Home Values in the Area
Average Home Value in this Area
Purchase History
| Date | Buyer | Sale Price | Title Company |
|---|---|---|---|
| Kim Jenny Yunjung | -- | -- | |
| Kim Jenny Yunjung | -- | -- | |
| Kim Sang K | -- | -- | |
| Kim Sang K | -- | -- | |
| Kim Sang Ki | $450,100 | -- |
Source: Public Records
Mortgage History
| Date | Status | Borrower | Loan Amount |
|---|---|---|---|
| Previous Owner | Kim Sang K | $180,000 | |
| Previous Owner | Kim Sang Ki | $300,000 |
Source: Public Records
Tax History
| Year | Tax Paid | Tax Assessment Tax Assessment Total Assessment is a certain percentage of the fair market value that is determined by local assessors to be the total taxable value of land and additions on the property. | Land | Improvement |
|---|---|---|---|---|
| 2025 | $14,309 | $463,640 | $150,160 | $313,480 |
| 2023 | $13,456 | $476,720 | $150,160 | $326,560 |
| 2022 | $10,567 | $344,360 | $54,040 | $290,320 |
| 2021 | $10,533 | $334,320 | $52,440 | $281,880 |
| 2020 | $9,428 | $292,880 | $44,000 | $248,880 |
| 2019 | $1,134 | $287,680 | $43,200 | $244,480 |
| 2018 | $9,150 | $280,960 | $42,200 | $238,760 |
| 2017 | $8,867 | $260,520 | $40,360 | $220,160 |
| 2016 | $8,739 | $260,520 | $40,360 | $220,160 |
| 2015 | $8,836 | $260,520 | $40,360 | $220,160 |
| 2014 | $6,438 | $182,560 | $30,240 | $152,320 |
Source: Public Records
Map
Nearby Homes
- 5425 Hoylake Ct
- 5435 Chelsen Wood Dr
- 5435 Hoylake Ct
- 5385 Chelsen Wood Dr
- 4651 River Ct Unit 3
- 9240 Prestwick Club Dr
- 264 Summerour Vale
- 175 High Bluff Ct
- 120 Summerour Vale
- 195 High Bluff Ct
- 4611 Medlock Bridge Rd
- 335 Marshy Pointe
- 5161 Dinant Dr
- 5360 Northwater Way
- 5048 Dinant Dr
- 110 Aster Cir
- 3870 River Mansion Dr
- 4248 River District Dr
- 395 Pelton Ct
- 4218 River District Dr
- 205 Frasher Way
- 210 Frasher Way
- 8970 Medlock Bridge Rd
- 5515 Chelsen Wood Dr
- 120 Roncard Ct Unit 1
- 8960 Medlock Bridge Rd
- 5490 Chelsen Wood Dr
- 5535 Chelsen Wood Dr
- 305 Mossy Pointe
- 5475 Chelsen Wood Dr Unit 1
- 5500 Chelsen Wood Dr
- 110 Roncard Ct
- 5510 Chelsen Wood Dr
- 315 Mossy Point
- 5520 Chelsen Wood Dr Unit 1
- 5465 Chelsen Wood Dr
- 8940 Medlock Bridge Rd
- 100 Roncard Ct
- 5530 Chelsen Wood Dr
- 5460 Chelsen Wood Dr
Your Personal Tour Guide
Ask me questions while you tour the home.