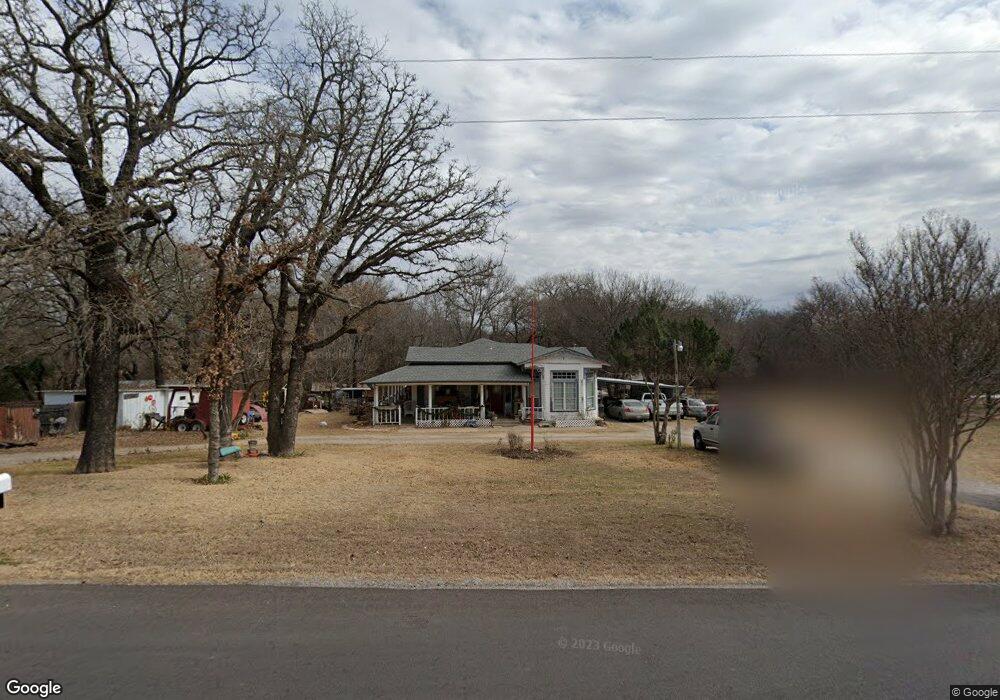
215 Greenwood Cut Off Rd Weatherford, TX 76088
Estimated Value: $380,149 - $473,000
--
Bed
--
Bath
1,914
Sq Ft
$219/Sq Ft
Est. Value
About This Home
This home is located at 215 Greenwood Cut Off Rd, Weatherford, TX 76088 and is currently estimated at $420,037, approximately $219 per square foot. 215 Greenwood Cut Off Rd is a home located in Parker County with nearby schools including Wright Elementary School, Hall Middle School, and Weatherford High School.
Ownership History
Date
Name
Owned For
Owner Type
Purchase Details
Closed on
Dec 6, 2016
Sold by
Bideler David Deforest
Bought by
Rlt David Deforest Bideler
Current Estimated Value
Purchase Details
Closed on
Dec 23, 2009
Sold by
Larvin Amy and Silvey Amy
Bought by
Bideler Dave and Bideler Marlene
Home Financials for this Owner
Home Financials are based on the most recent Mortgage that was taken out on this home.
Original Mortgage
$88,000
Outstanding Balance
$57,399
Interest Rate
4.9%
Mortgage Type
New Conventional
Estimated Equity
$362,638
Purchase Details
Closed on
Dec 5, 2005
Sold by
Shields Gayla A
Bought by
Bideler Dave and Bideler Marlene
Purchase Details
Closed on
Jul 16, 1998
Bought by
Bideler Dave and Bideler Marlene
Purchase Details
Closed on
Jul 11, 1990
Bought by
Bideler Dave and Bideler Marlene
Create a Home Valuation Report for This Property
The Home Valuation Report is an in-depth analysis detailing your home's value as well as a comparison with similar homes in the area
Home Values in the Area
Average Home Value in this Area
Purchase History
| Date | Buyer | Sale Price | Title Company |
|---|---|---|---|
| Rlt David Deforest Bideler | -- | None Available | |
| Bideler Dave | -- | Providence Title | |
| Bideler Dave | -- | -- | |
| Silvey Amy | -- | None Available | |
| Bideler Dave | -- | -- | |
| Bideler Dave | -- | -- |
Source: Public Records
Mortgage History
| Date | Status | Borrower | Loan Amount |
|---|---|---|---|
| Open | Bideler Dave | $88,000 |
Source: Public Records
Tax History Compared to Growth
Tax History
| Year | Tax Paid | Tax Assessment Tax Assessment Total Assessment is a certain percentage of the fair market value that is determined by local assessors to be the total taxable value of land and additions on the property. | Land | Improvement |
|---|---|---|---|---|
| 2025 | $5,894 | $300,000 | $120,960 | $179,040 |
| 2024 | $5,894 | $362,060 | $131,510 | $230,550 |
| 2023 | $5,894 | $362,060 | $131,510 | $230,550 |
| 2022 | $4,601 | $247,110 | $81,240 | $165,870 |
| 2021 | $4,988 | $247,110 | $81,240 | $165,870 |
| 2020 | $3,644 | $179,670 | $56,640 | $123,030 |
| 2019 | $3,888 | $179,670 | $56,640 | $123,030 |
| 2018 | $2,902 | $133,420 | $31,290 | $102,130 |
| 2017 | $2,961 | $133,420 | $31,290 | $102,130 |
| 2016 | $2,877 | $129,630 | $31,290 | $98,340 |
| 2015 | $1,349 | $129,630 | $31,290 | $98,340 |
| 2014 | $1,458 | $120,540 | $31,290 | $89,250 |
Source: Public Records
Map
Nearby Homes
- 100 Overton Ridge Cir
- 2435 Old Mineral Wells Hwy
- 1035 Estancia Blvd
- 1027 Estancia Blvd
- 4009 Estancia Ct
- 2056 Vaquero Dr
- 3703 Greenwood Rd
- 119 Michael Ln
- 105 Michael Ln
- 103 Saddle Club Rd
- 1930 Old Mineral Wells Hwy
- 119 Forest Creek Cir
- TBD Old Mineral Wells Hwy
- 1882 Old Mineral Wells Hwy
- 134 Forest Creek Cir
- 209 Grace Ct
- 167 Duke Trail
- 4710 Mineral Wells Hwy
- 1008 Salvation Dr
- 1802 Greenwood Rd
- 210 Greenwood Cut Off Rd
- 211 Greenwood Cut Off Rd
- 225 Greenwood Cut Off Rd
- 220 Greenwood Cut Off Rd
- 121 Greenwood Cut Off Rd Unit 5.850
- 121 Greenwood Cut Off Rd
- 3075 Mineral Wells Hwy
- 209 Greenwood Cut Off Rd
- 303 Greenwood Cut Off Rd
- 302 Greenwood Cut Off Rd
- 109 Country Oaks Ln
- 120 Country Oaks Ln
- 311 Greenwood Cut Off Rd
- 112 Country Oaks Ln
- 106 Country Oaks Ln
- 2912 Greenlee Park Trail
- 2912 Greenlee Park
- 310 Greenwood Cut Off Rd
- 250 Greenlee Park Trail
- 0 Greenlee Park Trail