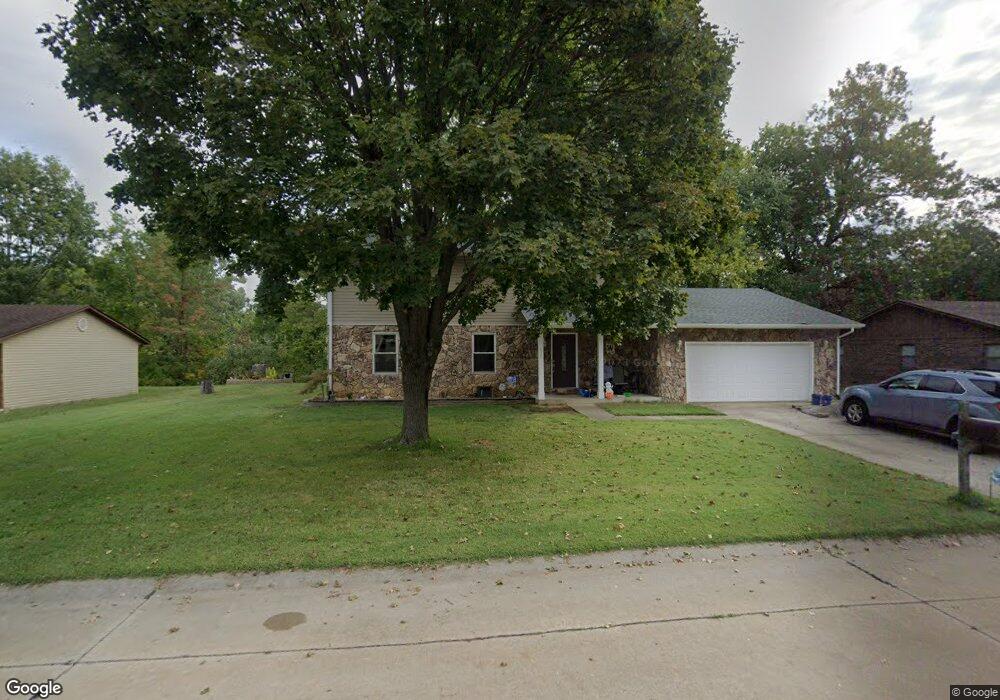
215 Hall Point Fairview Heights, IL 62208
Estimated Value: $227,000 - $311,180
4
Beds
3
Baths
2,366
Sq Ft
$111/Sq Ft
Est. Value
About This Home
This home is located at 215 Hall Point, Fairview Heights, IL 62208 and is currently estimated at $263,545, approximately $111 per square foot. 215 Hall Point is a home located in St. Clair County with nearby schools including William Holliday Elementary School, Pontiac William Holliday Jr High School, and Elite Scholars STEAM Academy.
Ownership History
Date
Name
Owned For
Owner Type
Purchase Details
Closed on
Jun 30, 2023
Sold by
Watkins Christopher D
Bought by
Watkins Christopher D and Watkins Stephanie K
Current Estimated Value
Purchase Details
Closed on
Mar 22, 2011
Sold by
Nationstar Mortgage Llc
Bought by
Watkins Christopher D
Home Financials for this Owner
Home Financials are based on the most recent Mortgage that was taken out on this home.
Original Mortgage
$104,287
Interest Rate
4.77%
Mortgage Type
FHA
Purchase Details
Closed on
May 25, 2010
Sold by
Mccottrell Wade Cheri
Bought by
Nationstar Mortgage Llc
Purchase Details
Closed on
Feb 17, 2006
Sold by
Mccottrell Cheri
Bought by
Mccottrell Wade Cheri
Home Financials for this Owner
Home Financials are based on the most recent Mortgage that was taken out on this home.
Original Mortgage
$151,500
Interest Rate
8.5%
Mortgage Type
Fannie Mae Freddie Mac
Create a Home Valuation Report for This Property
The Home Valuation Report is an in-depth analysis detailing your home's value as well as a comparison with similar homes in the area
Home Values in the Area
Average Home Value in this Area
Purchase History
| Date | Buyer | Sale Price | Title Company |
|---|---|---|---|
| Watkins Christopher D | -- | None Available | |
| Watkins Christopher D | $107,000 | Fatic | |
| Nationstar Mortgage Llc | -- | None Available | |
| Mccottrell Wade Cheri | -- | None Available |
Source: Public Records
Mortgage History
| Date | Status | Borrower | Loan Amount |
|---|---|---|---|
| Previous Owner | Watkins Christopher D | $104,287 | |
| Previous Owner | Mccottrell Wade Cheri | $151,500 |
Source: Public Records
Tax History Compared to Growth
Tax History
| Year | Tax Paid | Tax Assessment Tax Assessment Total Assessment is a certain percentage of the fair market value that is determined by local assessors to be the total taxable value of land and additions on the property. | Land | Improvement |
|---|---|---|---|---|
| 2024 | $5,124 | $85,370 | $12,353 | $73,017 |
| 2023 | $4,703 | $75,535 | $10,930 | $64,605 |
| 2022 | $3,822 | $61,408 | $10,714 | $50,694 |
| 2021 | $3,703 | $58,284 | $10,169 | $48,115 |
| 2020 | $3,647 | $55,209 | $9,632 | $45,577 |
| 2019 | $3,508 | $55,209 | $9,632 | $45,577 |
| 2018 | $3,685 | $56,459 | $10,297 | $46,162 |
| 2017 | $3,988 | $54,169 | $9,880 | $44,289 |
| 2016 | $3,959 | $52,946 | $9,657 | $43,289 |
| 2014 | $3,122 | $47,413 | $9,121 | $38,292 |
| 2013 | $3,223 | $48,287 | $9,289 | $38,998 |
Source: Public Records
Map
Nearby Homes
- 224 Hall Point
- 4906 Lawrence Dr
- 113 Lakeland Hills Dr
- 112 Lake Stratford Ct
- 109 Bourdelais Dr
- 201 Big Bend Blvd
- 105 Chateau Dr
- 18 Elvira Dr
- 4480 Biverton Dr
- 3920 Michael John Dr
- 505 Thistle Ln
- 114 Ashland Ave
- 405 Joseph Dr Unit G
- 525 Big Bend Blvd
- 4171 Addiston Dr
- 4167 Addiston Dr
- 318 Union Hill Rd
- 122 Ashland Ave
- 923 Millikin Dr
- 214 Union Hill Rd
- 207 Hall Point
- 217 Hall Point
- 208 Lawrence Ct
- 200 Lawrence Ct
- 4919 Lawrence Dr
- 201 Hall Point
- 216 Hall Point
- 216 Lawrence Ct
- 200 Hall Point
- 201 Lakeland Hills Dr
- 4922 Lawrence Dr
- 221 Hall Point
- 4926 Lawrence Dr
- 4918 Lawrence Dr
- 209 Lakeland Hills Dr
- 237 Oakridge Ct
- 140 Lakeland Hills Dr
- 241 Oakridge Ct
- 233 Oakridge Ct
- 213 Lakeland Hills Dr