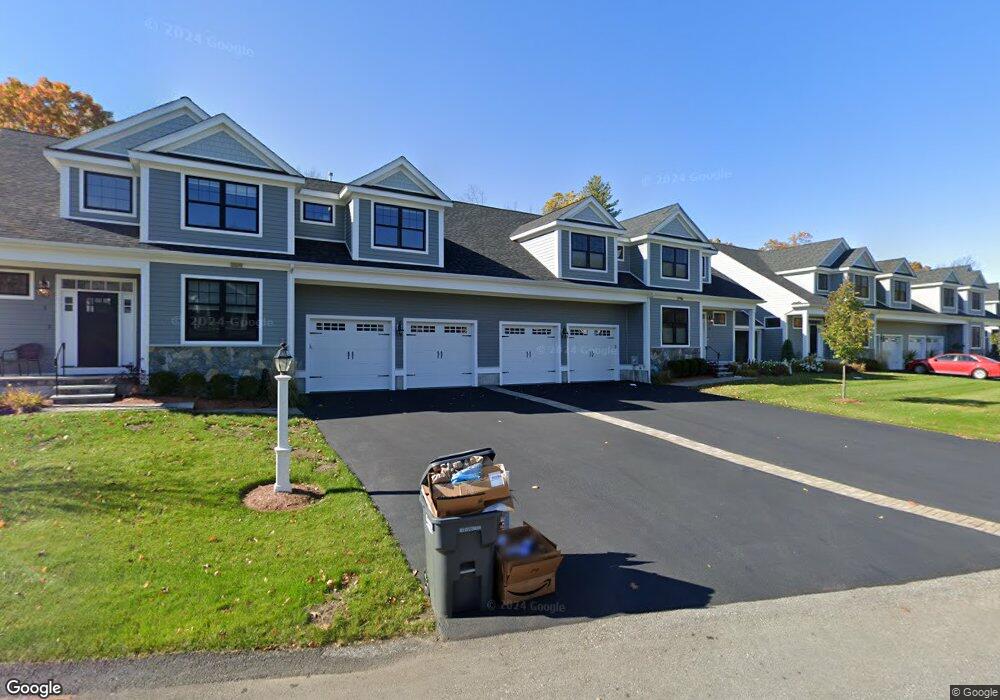
215 Hayden Rowe St Hopkinton, MA 01748
Estimated Value: $595,000
6
Beds
4
Baths
5,867
Sq Ft
$101/Sq Ft
Est. Value
About This Home
This home is located at 215 Hayden Rowe St, Hopkinton, MA 01748 and is currently priced at $595,000, approximately $101 per square foot. 215 Hayden Rowe St is a home located in Middlesex County with nearby schools including Marathon Elementary School, Hopkins Elementary School, and Elmwood Elementary School.
Ownership History
Date
Name
Owned For
Owner Type
Purchase Details
Closed on
Feb 27, 2015
Sold by
Perkins William and Perkins John
Bought by
Crosswinds Hopkinton L
Current Estimated Value
Home Financials for this Owner
Home Financials are based on the most recent Mortgage that was taken out on this home.
Original Mortgage
$2,596,330
Outstanding Balance
$1,987,058
Interest Rate
3.66%
Mortgage Type
Purchase Money Mortgage
Purchase Details
Closed on
May 4, 2011
Sold by
Wamu Mortgage Pass-Thr and Deutsche Bank Natl T
Bought by
Perkins William and Perkins John
Purchase Details
Closed on
Mar 8, 2011
Sold by
Thacker Linda
Bought by
Hopkinton Town Of
Purchase Details
Closed on
Feb 5, 2010
Sold by
Thacker Linda
Bought by
Deutsche Bank Natl T C
Purchase Details
Closed on
Jan 25, 2005
Sold by
Alexander C Rt
Bought by
Thacker Linda
Home Financials for this Owner
Home Financials are based on the most recent Mortgage that was taken out on this home.
Original Mortgage
$243,963
Interest Rate
5.71%
Create a Home Valuation Report for This Property
The Home Valuation Report is an in-depth analysis detailing your home's value as well as a comparison with similar homes in the area
Home Values in the Area
Average Home Value in this Area
Purchase History
| Date | Buyer | Sale Price | Title Company |
|---|---|---|---|
| Crosswinds Hopkinton L | $1,030,000 | -- | |
| Perkins William | $375,000 | -- | |
| Hopkinton Town Of | -- | -- | |
| Deutsche Bank Natl T C | $544,000 | -- | |
| Thacker Linda | $1,000,000 | -- | |
| Stevens Robert L | -- | -- |
Source: Public Records
Mortgage History
| Date | Status | Borrower | Loan Amount |
|---|---|---|---|
| Open | Crosswinds Hopkinton L | $2,596,330 | |
| Previous Owner | Stevens Robert L | $243,963 | |
| Previous Owner | Thacker Linda | $750,000 |
Source: Public Records
Tax History Compared to Growth
Tax History
| Year | Tax Paid | Tax Assessment Tax Assessment Total Assessment is a certain percentage of the fair market value that is determined by local assessors to be the total taxable value of land and additions on the property. | Land | Improvement |
|---|---|---|---|---|
| 2025 | -- | $0 | $0 | $0 |
| 2024 | -- | $0 | $0 | $0 |
| 2023 | $0 | $0 | $0 | $0 |
| 2022 | $0 | $0 | $0 | $0 |
| 2021 | $0 | $0 | $0 | $0 |
| 2019 | $11,478 | $0 | $0 | $0 |
| 2018 | $11,478 | $0 | $0 | $0 |
| 2017 | $11,478 | $0 | $0 | $0 |
| 2016 | $11,478 | $674,000 | $257,600 | $416,400 |
| 2015 | $11,579 | $644,700 | $253,300 | $391,400 |
Source: Public Records
Map
Nearby Homes
- 7 Davenport Ln Unit 7
- 211 Hayden Rowe St
- 10 Oak St
- 2 Emerald Dr
- 11 Kimball Rd
- 7 Myrtle Ave Unit 3
- 11 Myrtle Ave Unit 5
- 5 Myrtle Ave Unit 2
- 4 Myrtle Ave Unit 20
- 16 Fitch Ave Unit 6
- 13 Fitch Ave Unit 19
- 14 Fitch Ave Unit 7
- 11 Fitch Ave Unit 18
- 12 Fitch Ave Unit 8
- 4 Angelo Dr
- 10 Fitch Ave Unit 9
- 22 Sanctuary Ln
- 3 Fitch Ave Unit 14
- 165 Lumber St
- Lot 2 Hanlon Rd
- 8 Davenport Ln Unit 8
- 6 Davenport Ln Unit 6
- 4 Davenport Ln Unit 4
- 8 Davenport Ln Unit 2
- 6 Davenport Ln Unit 2
- 4 Davenport Ln Unit 2
- 5 Davenport Ln Unit 3
- 11 Davenport Ln Unit 11
- 10 Davenport Ln Unit 10
- 11 Davenport Ln Unit 7
- 10 Davenport Ln Unit 7
- 5 Davenport Ln Unit 5
- 18 Davenport Ln Unit 18
- 13 Davenport Ln Unit 13
- 12 Davenport Ln Unit 12
- 14 Davenport Ln Unit 14
- 16 Davenport Ln Unit 16
- 9 Davenport Ln Unit 9
- 3 Davenport Ln Unit 3
- 2 Davenport Ln Unit 2