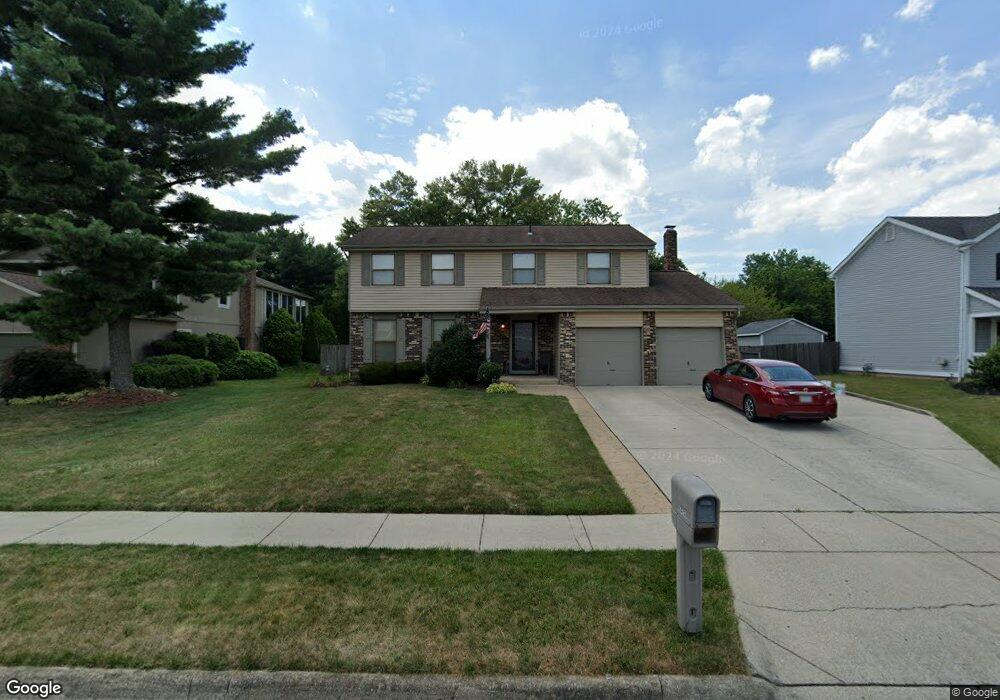
215 Highbury Crescent Columbus, OH 43230
Estimated Value: $393,000 - $419,000
4
Beds
3
Baths
1,932
Sq Ft
$213/Sq Ft
Est. Value
About This Home
This home is located at 215 Highbury Crescent, Columbus, OH 43230 and is currently estimated at $410,576, approximately $212 per square foot. 215 Highbury Crescent is a home located in Franklin County with nearby schools including Chapelfield Elementary School, Gahanna West Middle School, and Lincoln High School.
Ownership History
Date
Name
Owned For
Owner Type
Purchase Details
Closed on
May 31, 2000
Sold by
Matvey Mark S
Bought by
Gerhart Craig D
Current Estimated Value
Home Financials for this Owner
Home Financials are based on the most recent Mortgage that was taken out on this home.
Original Mortgage
$149,796
Outstanding Balance
$52,508
Interest Rate
8.14%
Mortgage Type
FHA
Estimated Equity
$358,068
Purchase Details
Closed on
Jul 28, 1999
Sold by
Gantt James F and Norwest Mtg Inc
Bought by
Matvey Mark S
Home Financials for this Owner
Home Financials are based on the most recent Mortgage that was taken out on this home.
Original Mortgage
$106,650
Interest Rate
8.21%
Purchase Details
Closed on
Aug 29, 1994
Sold by
Walz Mark D
Bought by
Gantt James F and Gantt Denise M
Home Financials for this Owner
Home Financials are based on the most recent Mortgage that was taken out on this home.
Original Mortgage
$122,450
Interest Rate
8.72%
Mortgage Type
VA
Purchase Details
Closed on
Nov 7, 1988
Purchase Details
Closed on
Jun 1, 1984
Create a Home Valuation Report for This Property
The Home Valuation Report is an in-depth analysis detailing your home's value as well as a comparison with similar homes in the area
Home Values in the Area
Average Home Value in this Area
Purchase History
| Date | Buyer | Sale Price | Title Company |
|---|---|---|---|
| Gerhart Craig D | $149,900 | Allodial Title | |
| Matvey Mark S | $118,500 | Allodial Title Company | |
| Gantt James F | $123,500 | -- | |
| -- | $107,800 | -- | |
| -- | $89,300 | -- |
Source: Public Records
Mortgage History
| Date | Status | Borrower | Loan Amount |
|---|---|---|---|
| Open | Gerhart Craig D | $149,796 | |
| Previous Owner | Matvey Mark S | $106,650 | |
| Previous Owner | Gantt James F | $122,450 |
Source: Public Records
Tax History Compared to Growth
Tax History
| Year | Tax Paid | Tax Assessment Tax Assessment Total Assessment is a certain percentage of the fair market value that is determined by local assessors to be the total taxable value of land and additions on the property. | Land | Improvement |
|---|---|---|---|---|
| 2024 | $7,241 | $122,920 | $33,320 | $89,600 |
| 2023 | $7,150 | $122,920 | $33,320 | $89,600 |
| 2022 | $5,981 | $77,810 | $17,330 | $60,480 |
| 2021 | $5,620 | $77,810 | $17,330 | $60,480 |
| 2020 | $5,573 | $77,810 | $17,330 | $60,480 |
| 2019 | $4,688 | $65,310 | $14,420 | $50,890 |
| 2018 | $4,317 | $65,310 | $14,420 | $50,890 |
| 2017 | $4,139 | $65,310 | $14,420 | $50,890 |
| 2016 | $3,976 | $54,960 | $11,730 | $43,230 |
| 2015 | $3,979 | $54,960 | $11,730 | $43,230 |
| 2014 | $3,949 | $54,960 | $11,730 | $43,230 |
| 2013 | $1,961 | $54,950 | $11,725 | $43,225 |
Source: Public Records
Map
Nearby Homes
- 404 Foxwood Dr
- 343 Imperial Dr
- 3610 N Stygler Rd
- 278 Empire Dr
- 206 Lintner St
- 470 Deerwood Ave E
- 175 Stonegate Cir
- 600 Agler Rd
- 373 Lyncroft Dr
- 364 Morgan Ln
- 209 Springbrook Place
- 221 Lincolnshire Rd
- 183 Serran Dr
- 642 Ridenour Rd
- 390 Dunbarton Rd
- 463 Lincolnshire Rd
- 219 N Hamilton Rd
- 379 Heil Dr
- 668 Kenilworth Ct
- 311 N Hamilton Rd
- 209 Highbury Crescent
- 221 Highbury Crescent
- 198 Rugby Ln
- 200 Rugby Ln
- 201 Highbury Crescent
- 227 Highbury Crescent
- 188 Rugby Ln
- 208 Rugby Ln
- 191 Gothic Ct
- 210 Highbury Crescent
- 200 Highbury Crescent
- 236 Highbury Crescent
- 214 Rugby Ln
- 235 Highbury Crescent
- 185 Gothic Ct
- 220 Rugby Ln
- 199 Rugby Ln
- 171 Rugby Ln
- 154 Rugby Ln
- 175 Rugby Ln