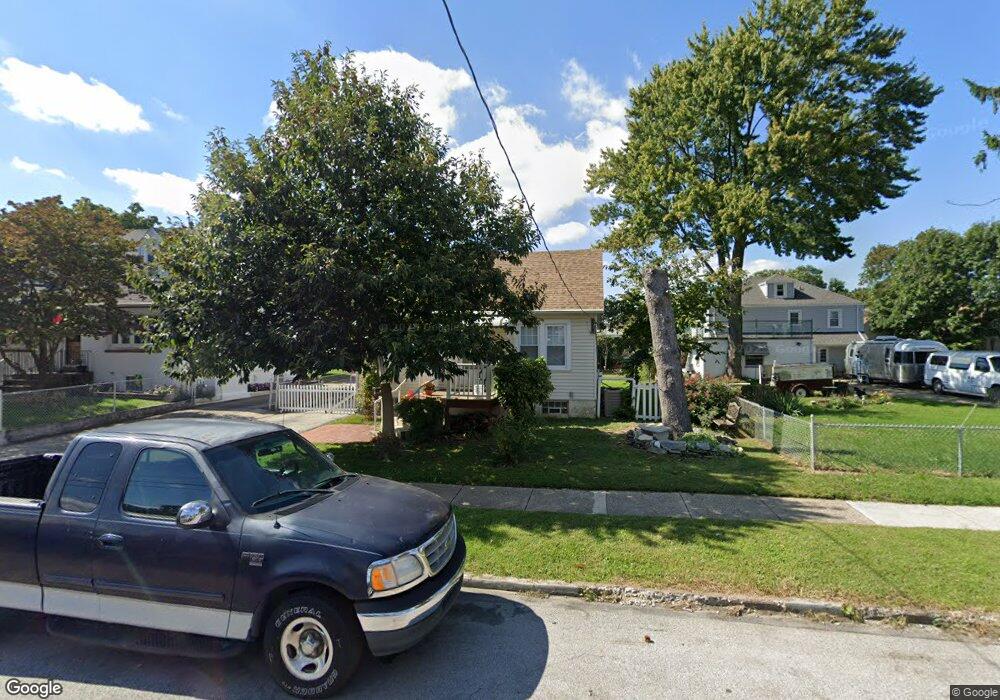
215 Lagrange Ave Essington, PA 19029
Estimated Value: $204,000 - $251,000
2
Beds
2
Baths
846
Sq Ft
$263/Sq Ft
Est. Value
About This Home
This home is located at 215 Lagrange Ave, Essington, PA 19029 and is currently estimated at $222,279, approximately $262 per square foot. 215 Lagrange Ave is a home located in Delaware County with nearby schools including Interboro Senior High School.
Ownership History
Date
Name
Owned For
Owner Type
Purchase Details
Closed on
May 3, 2023
Sold by
Vinpossen Julia-Anne
Bought by
Vanpossen Julia-Anne and Vanpossen Norman L
Current Estimated Value
Purchase Details
Closed on
Jul 18, 2000
Sold by
Hud
Bought by
Vanfossen Thomas and Vanfossen Julia Anne
Home Financials for this Owner
Home Financials are based on the most recent Mortgage that was taken out on this home.
Original Mortgage
$64,800
Interest Rate
7.87%
Mortgage Type
Purchase Money Mortgage
Purchase Details
Closed on
May 10, 2000
Sold by
Jones Paul W and Jones Roberta
Bought by
Hud
Purchase Details
Closed on
Mar 27, 1997
Sold by
Sinclair Thomas R
Bought by
Jones Paul W and Jones Roberta
Home Financials for this Owner
Home Financials are based on the most recent Mortgage that was taken out on this home.
Original Mortgage
$95,450
Interest Rate
7.5%
Mortgage Type
FHA
Create a Home Valuation Report for This Property
The Home Valuation Report is an in-depth analysis detailing your home's value as well as a comparison with similar homes in the area
Home Values in the Area
Average Home Value in this Area
Purchase History
| Date | Buyer | Sale Price | Title Company |
|---|---|---|---|
| Vanpossen Julia-Anne | -- | None Listed On Document | |
| Vanfossen Thomas | $81,000 | T A Title Insurance Company | |
| Hud | $925 | -- | |
| Jones Paul W | $95,500 | -- |
Source: Public Records
Mortgage History
| Date | Status | Borrower | Loan Amount |
|---|---|---|---|
| Previous Owner | Vanfossen Thomas | $64,800 | |
| Previous Owner | Jones Paul W | $95,450 |
Source: Public Records
Tax History Compared to Growth
Tax History
| Year | Tax Paid | Tax Assessment Tax Assessment Total Assessment is a certain percentage of the fair market value that is determined by local assessors to be the total taxable value of land and additions on the property. | Land | Improvement |
|---|---|---|---|---|
| 2025 | $4,375 | $138,400 | $35,790 | $102,610 |
| 2024 | $4,375 | $138,400 | $35,790 | $102,610 |
| 2023 | $4,302 | $138,400 | $35,790 | $102,610 |
| 2022 | $4,222 | $138,400 | $35,790 | $102,610 |
| 2021 | $6,254 | $138,400 | $35,790 | $102,610 |
| 2020 | $3,533 | $75,100 | $25,560 | $49,540 |
| 2019 | $3,527 | $75,100 | $25,560 | $49,540 |
| 2018 | $3,457 | $75,100 | $0 | $0 |
| 2017 | $3,374 | $75,100 | $0 | $0 |
| 2016 | $412 | $75,100 | $0 | $0 |
| 2015 | $412 | $75,100 | $0 | $0 |
| 2014 | $412 | $75,100 | $0 | $0 |
Source: Public Records
Map
Nearby Homes
- 207 Carre Ave
- 229 Saude Ave
- 231 Bartram Ave
- 120 Bartram Ave
- 403 Printz Ave
- 307 Jansen Ave
- 511 Corinthian Ave
- 521 Corinthian Ave
- 125 S Governor Printz Blvd
- 210 Powhattan Ave
- 303 Darby Rd
- 236 Haller Rd
- 741 Stockton Cir
- 731 Clymer Ln
- 242 Willard Dr
- 436 Manhattan St
- 236 Willard Dr
- 145 Haller Rd
- 213 Hoffman Rd
- 830 4th Ave
- 211 Lagrange Ave
- 219 Lagrange Ave
- 225 Lagrange Ave
- 214 Printz Ave
- 210 Printz Ave
- 220 Printz Ave
- 119 E 2nd St
- 121 E 2nd St
- 208 Printz Ave
- 231 Lagrange Ave
- 224 Printz Ave
- 216 Lagrange Ave
- 214 Lagrange Ave
- 212 Lagrange Ave
- 218 Lagrange Ave
- 220 Lagrange Ave
- 228 Printz Ave
- 222 Lagrange Ave
- 204 Printz Ave
- 224 Lagrange Ave