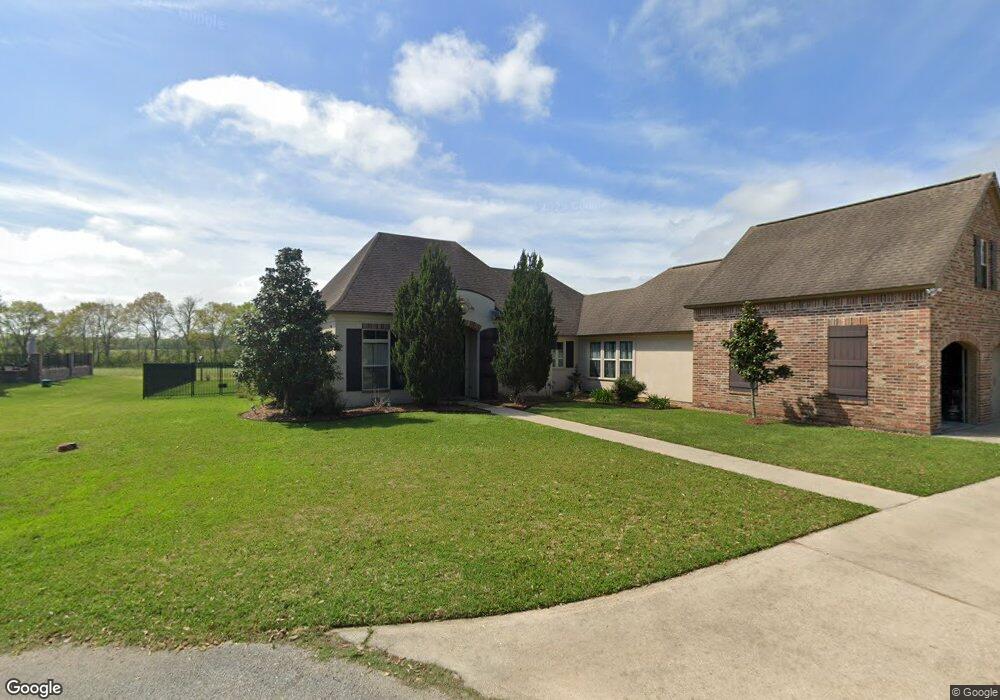
215 Lantana Ct Broussard, LA 70518
Estimated Value: $413,000 - $649,000
--
Bed
--
Bath
2,823
Sq Ft
$182/Sq Ft
Est. Value
About This Home
This home is located at 215 Lantana Ct, Broussard, LA 70518 and is currently estimated at $513,634, approximately $181 per square foot. 215 Lantana Ct is a home with nearby schools including Martial Billeaud Elementary School, Broussard Middle School, and O. Comeaux High School.
Ownership History
Date
Name
Owned For
Owner Type
Purchase Details
Closed on
Apr 26, 2013
Sold by
Craig Andrew Robert and Meche Andrew Susan
Bought by
Stansbury Theriot Gregory Duane and Stansbury Theriot Christine
Current Estimated Value
Home Financials for this Owner
Home Financials are based on the most recent Mortgage that was taken out on this home.
Original Mortgage
$320,000
Outstanding Balance
$228,679
Interest Rate
3.67%
Mortgage Type
New Conventional
Estimated Equity
$284,955
Purchase Details
Closed on
May 16, 2012
Sold by
Kauffman Royden Lynn and Kauffman Lisa Jane
Bought by
Craig Andrew Robert and Meche Andrew Susan
Purchase Details
Closed on
Mar 2, 2007
Sold by
Desormeaux Acosta John Christopher and Desormeaux Acosta Jennifer Lynn
Bought by
Kauffman Royden Lynn and Kauffman Lisa Jane Richard
Purchase Details
Closed on
Jun 8, 2005
Sold by
Desormeaux Emile and Desormeaux Linda S
Bought by
Desormeaux Acosta John C and Desormeaux Acosta Jennifer
Create a Home Valuation Report for This Property
The Home Valuation Report is an in-depth analysis detailing your home's value as well as a comparison with similar homes in the area
Home Values in the Area
Average Home Value in this Area
Purchase History
| Date | Buyer | Sale Price | Title Company |
|---|---|---|---|
| Stansbury Theriot Gregory Duane | $62,000 | None Available | |
| Craig Andrew Robert | $55,000 | None Available | |
| Craig Andrew Robert | $55,000 | None Available | |
| Kauffman Royden Lynn | $52,000 | None Available | |
| Desormeaux Acosta John C | $38,000 | None Available |
Source: Public Records
Mortgage History
| Date | Status | Borrower | Loan Amount |
|---|---|---|---|
| Open | Stansbury Theriot Gregory Duane | $320,000 |
Source: Public Records
Tax History Compared to Growth
Tax History
| Year | Tax Paid | Tax Assessment Tax Assessment Total Assessment is a certain percentage of the fair market value that is determined by local assessors to be the total taxable value of land and additions on the property. | Land | Improvement |
|---|---|---|---|---|
| 2024 | $2,737 | $39,080 | $4,668 | $34,412 |
| 2023 | $2,737 | $37,132 | $4,668 | $32,464 |
| 2022 | $3,210 | $37,132 | $4,668 | $32,464 |
| 2021 | $3,223 | $37,132 | $4,668 | $32,464 |
| 2020 | $3,219 | $37,132 | $4,668 | $32,464 |
| 2019 | $2,442 | $37,132 | $4,668 | $32,464 |
| 2018 | $2,496 | $37,132 | $4,668 | $32,464 |
| 2017 | $2,493 | $37,132 | $4,668 | $32,464 |
| 2015 | $2,385 | $35,944 | $3,480 | $32,464 |
| 2013 | -- | $35,944 | $3,480 | $32,464 |
Source: Public Records
Map
Nearby Homes
- 102 Queen Palm Cir
- 106 Avenue Des Freres
- 107 Terrace Oak Ln
- 700 Saint Nazaire Rd
- Tbd Highway 90
- 500 Blk Hardware Rd
- 200 Blk Hardware Rd
- Comstock III H - Ambassador Commons Plan at Ambassador Commons
- Romeno V G - Ambassador Commons Plan at Ambassador Commons
- Irises V G - Ambassador Commons Plan at Ambassador Commons
- 901 Summer St
- Trillium IV I - Ambassador Commons Plan at Ambassador Commons
- Oakstone V J - Ambassador Commons Plan at Ambassador Commons
- Yucca III G - Ambassador Commons Plan at Ambassador Commons
- Ravenswood V H - Ambassador Commons Plan at Ambassador Commons
- Dogwood IV J - Ambassador Commons Plan at Ambassador Commons
- Oakstone V I - Ambassador Commons Plan at Ambassador Commons
- Lasalle V H - Ambassador Commons Plan at Ambassador Commons
- Ravenswood V G - Ambassador Commons Plan at Ambassador Commons
- Ionia III H - Ambassador Commons Plan at Ambassador Commons
- 213 Lantana Ct
- 214 Lantana Ct
- 211 Lantana Ct
- 212 Lantana Ct
- 210 Lantana Ct
- 209 Lantana Ct
- 208 Lantana Ct
- 207 Lantana Ct
- 205 Lantana Ct
- 204 Lantana Ct
- 203 Lantana Ct
- 202 Lantana Ct
- 110 Lantana Ct
- 112 Lantana Ct
- 201 Lantana Ct
- 322 Highway 96
- 344 Highway 96
- 106 Lantana Ct
- 115 Lantana Ct
- 115 Lantana Ct Ct