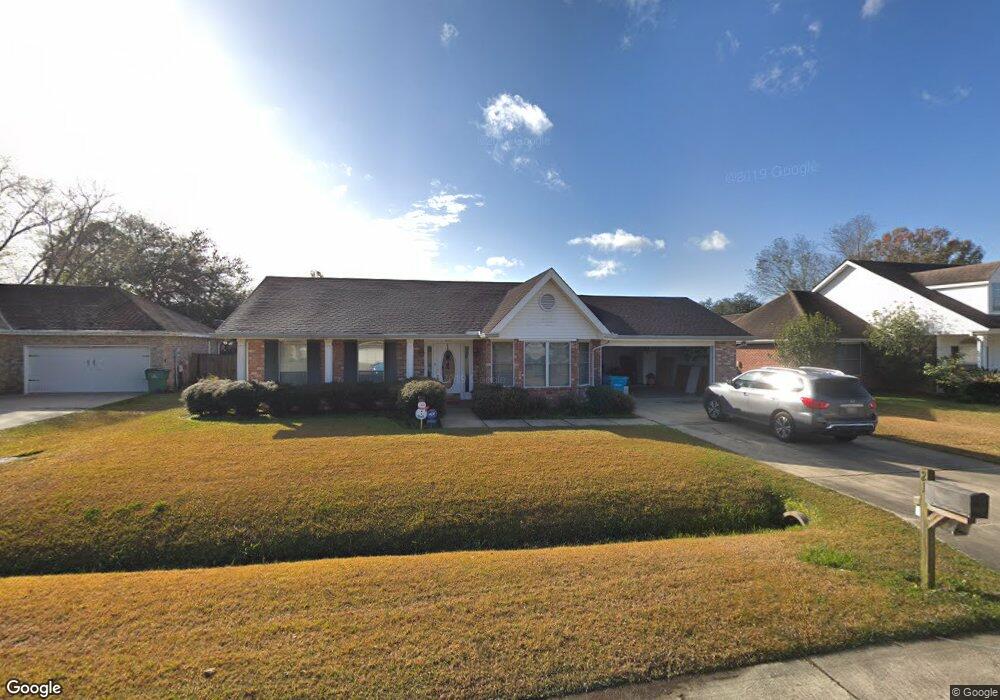
215 Laurel Ct Luling, LA 70070
Estimated Value: $290,303 - $347,000
3
Beds
2
Baths
1,935
Sq Ft
$165/Sq Ft
Est. Value
About This Home
This home is located at 215 Laurel Ct, Luling, LA 70070 and is currently estimated at $318,826, approximately $164 per square foot. 215 Laurel Ct is a home located in St. Charles Parish with nearby schools including Mimosa Park Elementary School, Lakewood Elementary School, and J.B. Martin Middle School.
Ownership History
Date
Name
Owned For
Owner Type
Purchase Details
Closed on
Aug 26, 2011
Sold by
Bastian Beryl and Dempster Todd L
Bought by
Pizzolato Justin Michael
Current Estimated Value
Home Financials for this Owner
Home Financials are based on the most recent Mortgage that was taken out on this home.
Original Mortgage
$203,775
Outstanding Balance
$139,132
Interest Rate
4.58%
Mortgage Type
New Conventional
Estimated Equity
$179,694
Create a Home Valuation Report for This Property
The Home Valuation Report is an in-depth analysis detailing your home's value as well as a comparison with similar homes in the area
Home Values in the Area
Average Home Value in this Area
Purchase History
| Date | Buyer | Sale Price | Title Company |
|---|---|---|---|
| Pizzolato Justin Michael | $214,500 | Bayou Title Inc |
Source: Public Records
Mortgage History
| Date | Status | Borrower | Loan Amount |
|---|---|---|---|
| Open | Pizzolato Justin Michael | $203,775 |
Source: Public Records
Tax History
| Year | Tax Paid | Tax Assessment Tax Assessment Total Assessment is a certain percentage of the fair market value that is determined by local assessors to be the total taxable value of land and additions on the property. | Land | Improvement |
|---|---|---|---|---|
| 2025 | $1,745 | $24,770 | $8,300 | $16,470 |
| 2024 | $1,745 | $24,770 | $8,300 | $16,470 |
| 2023 | $1,773 | $18,540 | $7,370 | $11,170 |
| 2022 | $1,802 | $15,412 | $7,370 | $8,042 |
| 2021 | $1,731 | $14,675 | $6,633 | $8,042 |
| 2020 | $2,190 | $18,540 | $7,370 | $11,170 |
| 2019 | $2,077 | $17,514 | $5,300 | $12,214 |
| 2018 | $2,061 | $17,514 | $5,300 | $12,214 |
| 2017 | $2,058 | $17,514 | $5,300 | $12,214 |
| 2016 | $2,067 | $17,514 | $5,300 | $12,214 |
| 2015 | $1,388 | $19,305 | $3,869 | $15,436 |
| 2014 | $1,337 | $19,305 | $3,869 | $15,436 |
| 2013 | $1,342 | $19,305 | $3,869 | $15,436 |
Source: Public Records
Map
Nearby Homes
- 376 Sophia Dr
- 358 Olivia Dr
- 335 Olivia Dr
- 604 Willowdale Blvd
- 25 Patricia Ct
- 14 Michael Dr
- 329 Sophia Drive None
- 117 Wisteria Ln
- 246 Olivia Dr
- 421 Willowdale Blvd
- 236 Sophia Dr
- 134 Sophia Dr
- 352 Sophia Dr
- 109 Sophia Dr
- 329 Sophia Dr
- Lot 36 Sophia Dr
- 332 Sophia Dr
- 138 Sophia Dr
- 328 Sophia Dr
- 113 Sophia Dr
Your Personal Tour Guide
Ask me questions while you tour the home.