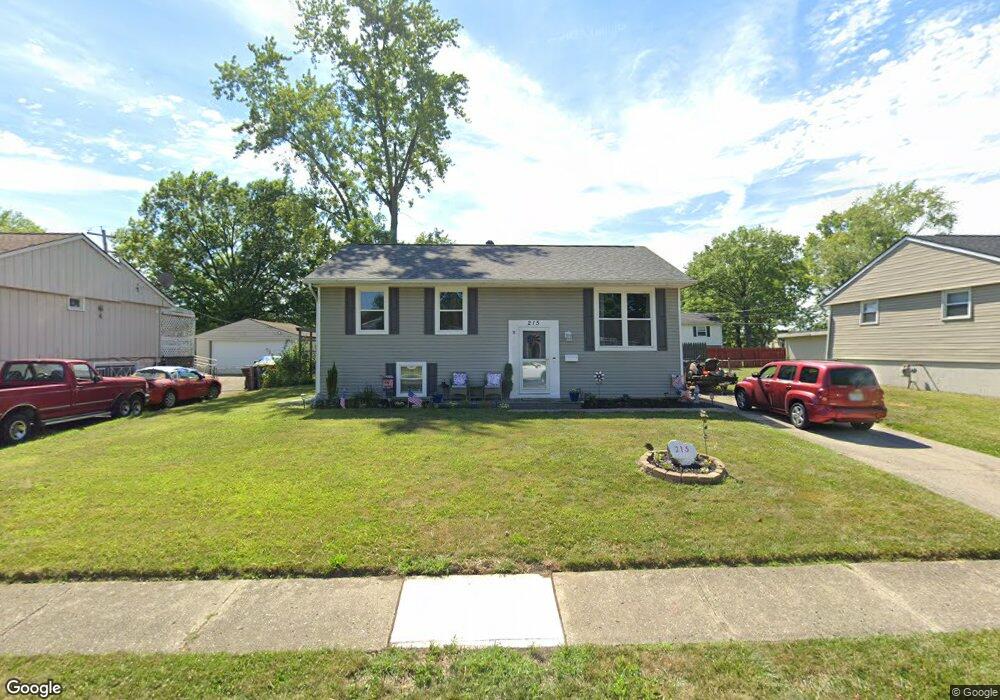
215 Lincolnshire Rd Columbus, OH 43230
Estimated Value: $236,762 - $284,000
3
Beds
2
Baths
1,437
Sq Ft
$181/Sq Ft
Est. Value
About This Home
This home is located at 215 Lincolnshire Rd, Columbus, OH 43230 and is currently estimated at $260,691, approximately $181 per square foot. 215 Lincolnshire Rd is a home located in Franklin County with nearby schools including Royal Manor Elementary School, Gahanna West Middle School, and Lincoln High School.
Ownership History
Date
Name
Owned For
Owner Type
Purchase Details
Closed on
May 15, 2023
Sold by
Culbertson Nancy
Bought by
Sturgill Thomas and Sturgill Rosa
Current Estimated Value
Home Financials for this Owner
Home Financials are based on the most recent Mortgage that was taken out on this home.
Original Mortgage
$122,971
Outstanding Balance
$119,552
Interest Rate
6.39%
Mortgage Type
Seller Take Back
Estimated Equity
$141,139
Purchase Details
Closed on
Dec 16, 2021
Sold by
Toensing David M
Bought by
Sturgill Thomas and Sturgill Rosa
Purchase Details
Closed on
Sep 22, 2009
Sold by
Ermlich Gregory S
Bought by
Sturgill Roy T and Toensing David M
Home Financials for this Owner
Home Financials are based on the most recent Mortgage that was taken out on this home.
Original Mortgage
$121,743
Interest Rate
5.19%
Mortgage Type
FHA
Create a Home Valuation Report for This Property
The Home Valuation Report is an in-depth analysis detailing your home's value as well as a comparison with similar homes in the area
Home Values in the Area
Average Home Value in this Area
Purchase History
| Date | Buyer | Sale Price | Title Company |
|---|---|---|---|
| Sturgill Thomas | $123,000 | None Listed On Document | |
| Sturgill Thomas | $97,000 | Vault Title Of Ohio | |
| Sturgill Roy T | $124,000 | Fati |
Source: Public Records
Mortgage History
| Date | Status | Borrower | Loan Amount |
|---|---|---|---|
| Open | Sturgill Thomas | $122,971 | |
| Previous Owner | Sturgill Roy T | $121,743 |
Source: Public Records
Tax History Compared to Growth
Tax History
| Year | Tax Paid | Tax Assessment Tax Assessment Total Assessment is a certain percentage of the fair market value that is determined by local assessors to be the total taxable value of land and additions on the property. | Land | Improvement |
|---|---|---|---|---|
| 2024 | $4,355 | $73,920 | $23,800 | $50,120 |
| 2023 | $4,278 | $73,540 | $23,800 | $49,740 |
| 2022 | $3,649 | $48,870 | $12,850 | $36,020 |
| 2021 | $3,530 | $48,870 | $12,850 | $36,020 |
| 2020 | $3,500 | $48,870 | $12,850 | $36,020 |
| 2019 | $2,844 | $39,620 | $10,710 | $28,910 |
| 2018 | $2,823 | $39,620 | $10,710 | $28,910 |
| 2017 | $2,610 | $39,620 | $10,710 | $28,910 |
| 2016 | $2,818 | $38,960 | $9,450 | $29,510 |
| 2015 | $2,820 | $38,960 | $9,450 | $29,510 |
| 2014 | $2,798 | $38,960 | $9,450 | $29,510 |
| 2013 | $1,390 | $38,955 | $9,450 | $29,505 |
Source: Public Records
Map
Nearby Homes
- 221 Lincolnshire Rd
- 3888 Agler Rd
- 600 Agler Rd
- 3784 Armuth Ave
- 2694 Kantian Dr
- 491 Daventry Ln
- 4125 Emerius Dr
- 388 Elkwood Place
- 0 E Minnesota Ave Unit 224018641
- 2423 Stelzer Rd
- 348 Imperial Dr
- 2275 Stelzer Rd
- 3832 Emmons Ave
- 0 E Emmons Ave
- 2457 Ashpoint St
- 3601 Agler Rd
- 3877 Hines Rd
- 536 Springwood Lake Dr
- 1822 Stelzer Rd
- 3150 Berkley Pointe Dr
- 209 Lincolnshire Rd
- 203 Lincolnshire Rd
- 227 Lincolnshire Rd
- 212 Lincolnshire Rd
- 218 Lincolnshire Rd
- 197 Lincolnshire Rd
- 233 Lincolnshire Rd
- 661 Fairholme Rd
- 196 Lincolnshire Rd
- 191 Lincolnshire Rd
- 652 Knights Ave
- 239 Lincolnshire Rd
- 695 Codet Rd Unit 697
- 653 Fairholme Rd
- 657 Knights Ave
- 662 Fairholme Rd
- 185 Lincolnshire Rd
- 644 Knights Ave
- 188 Lincolnshire Rd
- 647 Fairholme Rd